Figure 4.
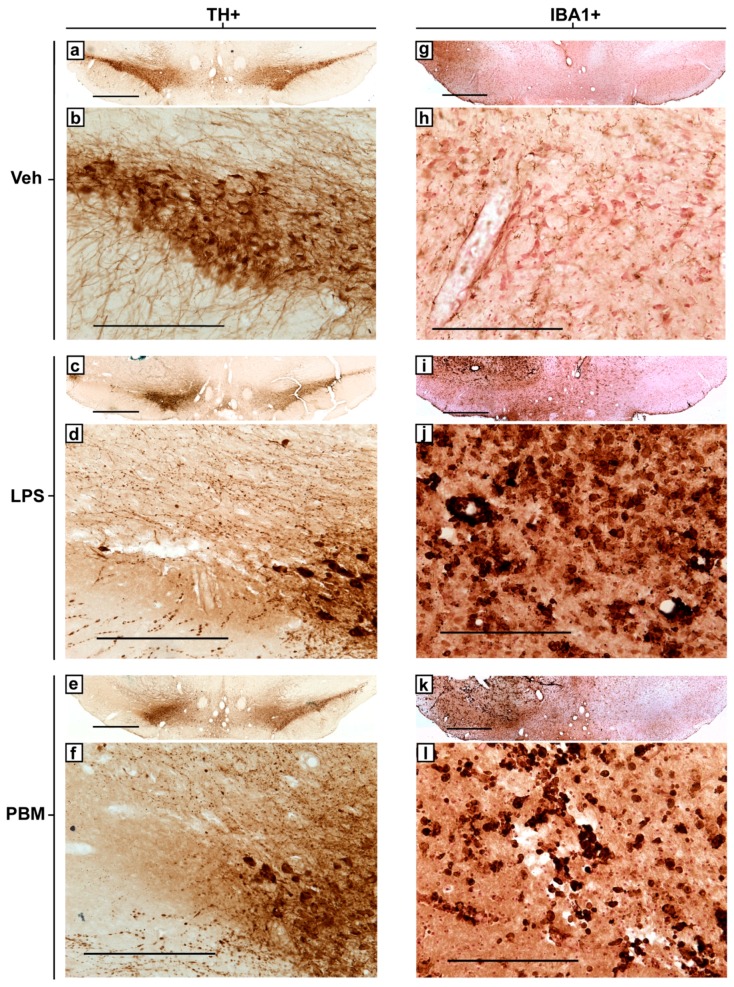
Representative photomicrographs of TH+ and IBA1+ immunostaining in the SNc of 20 µg LPS-treated rats from each experimental group at the same bregma level. (a) Bilateral and (b) injection-side TH+ staining for a vehicle rat. (c) Bilateral and (d) injection-side TH+ staining for a representative LPS rat. Large areas of the SNc are without intact cells, and nearby remaining cells increased in their expression of TH. Remaining processes are punctate and dystrophic. (e) Bilateral and (f) injection-side TH+ staining for a representative PBM rat. (g) Bilateral and (h) injection-side IBA1+ staining for a vehicle rat. Cells were ramified or rod-like in morphology with long, distinguished processes. Brown staining: immunostaining precipitate. Pink-red staining: neutral red cell body counterstain. (i) Bilateral and (j) injection-side IBA1+ staining for an LPS-only rat. IBA1+ microglia greatly increased in density and retracted their processes to take on an amoeboid morphology. Regions with complete TH+ cell loss corresponded with regions exhibiting IBA1+ microglia with majority amoeboid morphology. (k) Bilateral and (l) injection-side IBA1+ staining for a PBM rat, showing similarities to LPS rats with a similar lesion size. TH+ and IBA1+ stained sections for each experimental group were from adjacent sections in the same rat. Bilateral 4× images (a,c,e,g,i,k; scale bar 1 mm) present the SNc of both sides with the injection side on the left, while magnified 20× unilateral (injection-side only) images (b,d,f,h,j,l; scale bar 250 μm) allow for visualisation of cellular morphology.

