Figure 2.
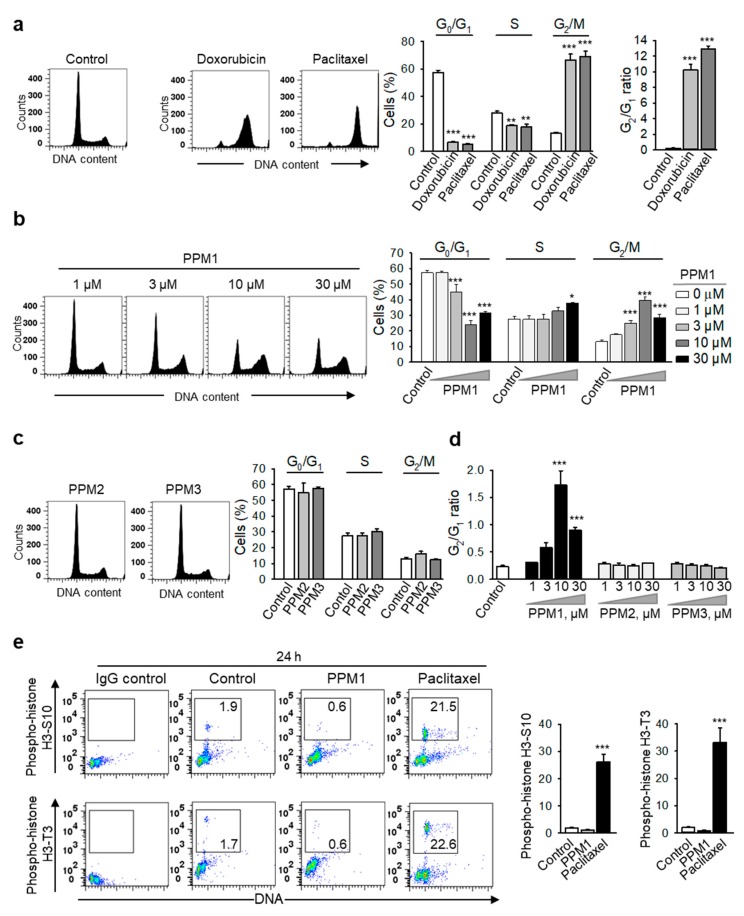
PPM1, but not PPM2 or PPM3, induces a concentration-dependent accumulation of breast cancer cells in the G2 phase. MDA-MB-231 cells were treated with doxorubicin (100 nM) or paclitaxel (100 nM) (a), different concentrations of PPM1 (b), PPM2 or PPM3 (each 30 µM) (c) for 24 h. DNA was stained with propidium iodide and cells were analyzed by using flow cytometry. Representative histograms are shown on the left. Bar graphs on the right show the percentages of MDA-MB-231 cells in each phase of the cell cycle. (d) Graph shows the mean G2/G1 ratio of cells treated as in (b) and (c). (e) Different to paclitaxel, PPM1 did not increase the mitotic p-H3 cell population. MDA-MB-231 cells were treated with 10 µM PPM1 or 100 nM paclitaxel for 24 h, fixed, permeabilized with methanol, stained with antibodies against phosphorylated histone H3-S10 and H3-T3 and propidium iodide, and analyzed by flow cytometry. Representative dot blots are shown. Graphs show percentage of mitotic p-H3-T3+ cells. Statistical analysis was performed by using the Newman-Keuls test. Data are mean ± SEM, n = 3, * p < 0.05, ** p < 0.01, *** p < 0.001.

