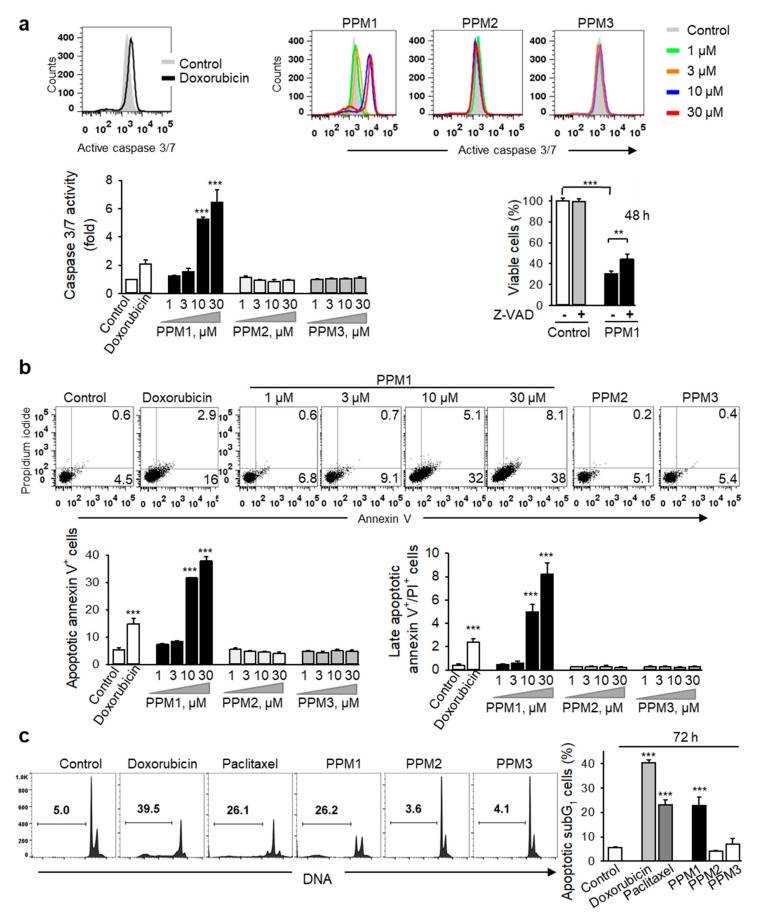
Figure 6.
PPM1 induces apoptosis in breast cancer cells. (a) PPM1 induces activation of caspase 3/7 in breast cancer cells, which is partly responsible for its cytotoxicity. MDA-MB-231 cells were treated with different concentrations of the polyhalogenated monoterpenes or doxorubicin (100 nM) for 24 h, incubated with the caspase 3 substrate Z-DEVD-R110, and the fluorescent cleavage product was analyzed by using flow cytometry. Representative histograms are shown. Left hand graph shows the caspase 3/7 activity expressed as fold increase compared to the control. Right hand graph shows viability of MDA-MB-231 cells pretreated with the pancaspase inhibitor Z-VAD-fmk (50 µM) for 2 h, then treated with PPM1 (10 µM) for further 48 h, and analyzed using XTT assay. (b) MDA-MB-231 cells were treated for 48 h as described in (a), stained with FITC-annexin V/propidium iodide and analyzed by using flow cytometry. Representative dot plots are shown; PPM2 or PPM3 (each at 30 µM). Graphs represent quantitative data of the distribution of apoptotic cells based on annexin V/PI co-staining. (c) PPM1 induces DNA fragmentation in breast cancer cells. MDA-MB-231 cells were treated for 72 h with either PPM1, PPM2, PPM3 (10 µM, each), 100 nM doxorubicin, or 100 nM paclitaxel. DNA of the treated cells was stained with propidium iodide and analyzed by flow cytometry. Representative histograms are shown. Numbers indicate percentage of subdiploid apoptotic cells (subG1). Graph shows the percentages of subG1 cells. All data are mean ± SEM, n = 3, ** p < 0.01, *** p < 0.001 vs. control.

