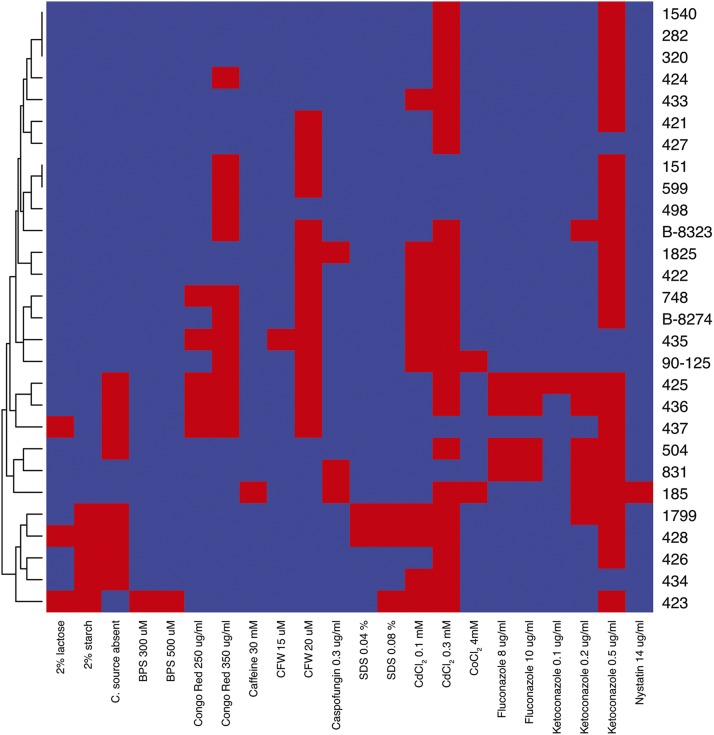
Figure 1.
Phenotype analysis of C. orthopsilosis isolates. Growth defects of 28 C. orthopsilosis strains (y-axis) on solid media (x-axis). Chemicals were added to YPD at the indicated concentrations. All media contained 2% glucose, except where substituted with 2% lactose or 2% starch. Growth scores were calculated by comparing the average growth of at least 4 replicates on each condition to growth on YPD, using SGAtools. Scores ≤0.45 (decreased growth) are shown in red, and all other scores are in blue. Only conditions for which a growth defect is observed for at least one strain are shown. Scores are visualized using the gplots package in R (Warnes et al. 2016).

