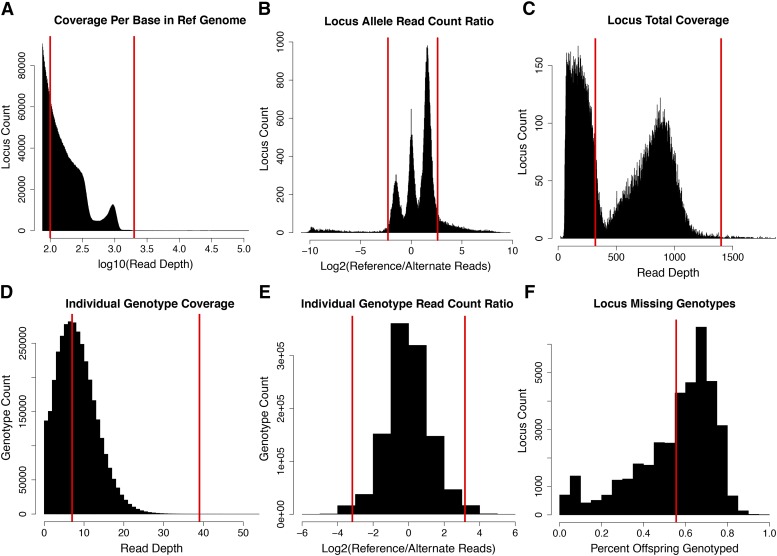
Figure 2.
Designation of data filter thresholds guided by visualization of sequence/allele coverage and missing data distributions. Thresholds for our data were determined with simple visualizations of allele and sequence depth for loci and genotypes. Cutoff values at each filter step are indicated on plots with red vertical lines. Filters are for entire loci or individual genotypes (column 1). Each panel (A-F) corresponds to the filter in Table 1. These thresholds are specific to our data and are aimed at reducing genotype errors that are expected in reference genome alignment. Mapping algorithms are sensitive to erroneous genotypes and their removal increased the co-linearity of genomic scaffolds and markers in each of our maps that were estimated from recombination in either parent. We set these thresholds by visualizing: A) The log10 coverage for each base in the reference genome (depth > 75). B) The log2 ratio of read counts for the major and minor alleles for each locus. C) The distribution of total coverage for each locus summed across all individuals. D) The distribution of individual genotype coverage (major + minor allele). E) The log2 ratio of major to minor alleles for individual heterozygote genotypes. F) The distribution of missing data in remaining loci (percent of offspring genotyped).

