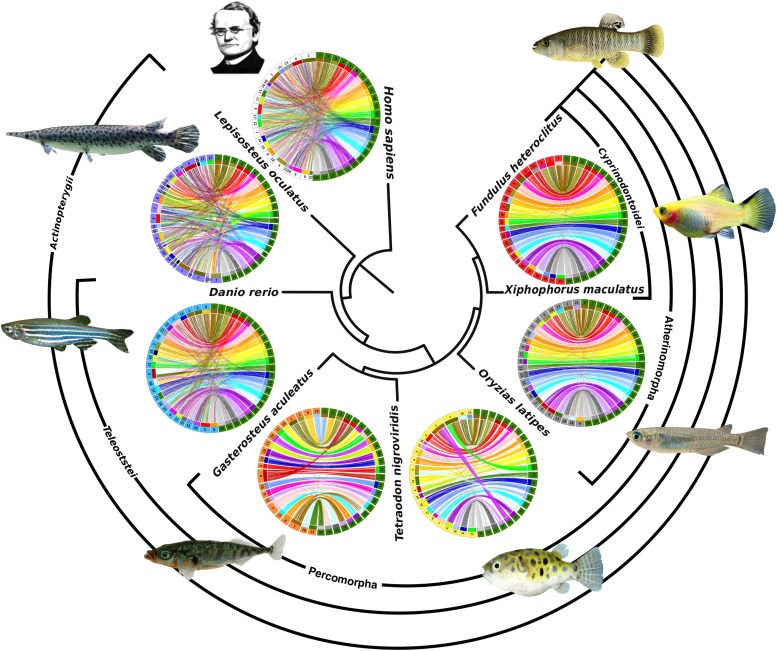
Figure 4.
Comparisons of conserved synteny within a phylogenetic framework. Phylogenetic relationship of each species (reference genomes that were mapped to chromosomes) to killifish, indicated at center, increases in distance clockwise from Fundulus heteroclitus (top right). Killifish LGs (green segments at right in each Circos plot) are ordered (1-24) and compared to mapped chromosomes in each species. Colored lines (colored by killifish LG number) in each plot connect the positions of one-to-one ortholog genes between the species. Chromosomes around each Circos plot are ordered by the largest number of orthologs relative to each killifish LG. Highly conserved synteny and orthology (nearly all lines on a chromosome connect to a single killifish LG) was used to identify the homologous chromosomes in percomophs. For larger Circos plots that identify homologs in each species, see supplemental File S6. Fish images were reproduced under the Creative Commons License (File S9).

