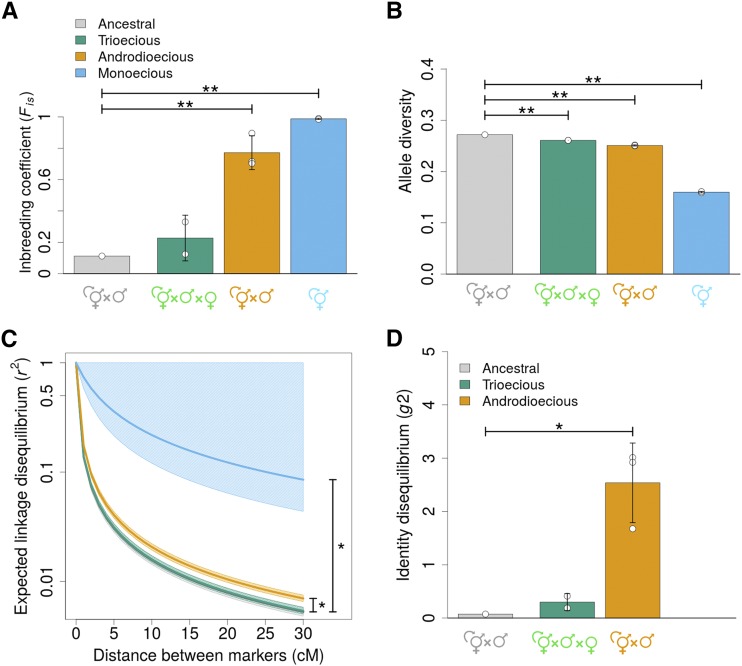
Figure 2.
Genetic diversity comparison between the ancestral population and populations evolved under the three different reproductive modes. Legend colors apply equally to all panels. (a, b), Higher inbreeding coefficients () are seen in monoecious and androdioecious populations than in the ancestral or trioecious populations, while SNP allele diversity () is almost halved only in monoecious populations. (c), Linkage disequilibrium within chromosomes, shown as the expected decay in with genetic distance (cM). Data were fitted with , with respect to x and lines represent fitted values for ancestral and derived populations with shaded areas showing 95% confidence intervals (see Materials and Methods). Lines from the ancestral and trioecious populations overlap. Y axis is shown in a logarithmic scale. (d), Expected identity disequilibrium () is shown with exception of monoecious populations that have no heterozygotes. Means and one SD among replicate populations (dots) are shown (see Materials and Methods). Asterisks show significant differences between experimentally evolved populations and the ancestral population for p-values < 0.05 (*) or p-values < 0.005 (**).

