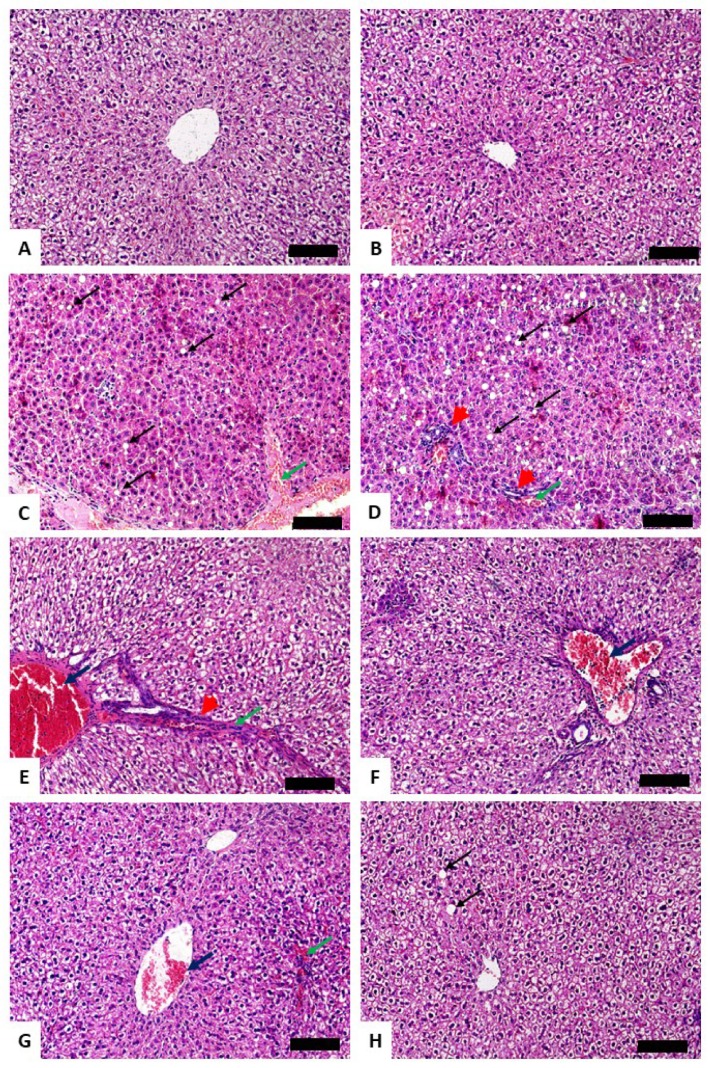
Figure 2.
Photomicrographs of liver sections of (A) control and (B) Gal-treated rats showing normal liver architecture, (C–E) CP-intoxicated rats showing degenerative changes and cytoplasmic vacuolations (black arrow), leukocyte infiltration (arrowhead), hemorrhage (green arrow), and congestions (blue arrow), and CP-induced rats pre-treated with (F) 15 mg/kg, (G) 30 mg/kg, and (H) 60 mg/kg Gal showing mild congestion (blue arrow), hemorrhage (green arrow), and cytoplasmic vacuolations (black arrow). (Hematoxylin and eosin (H&E); X200) (Scale bar = 100 µm).

