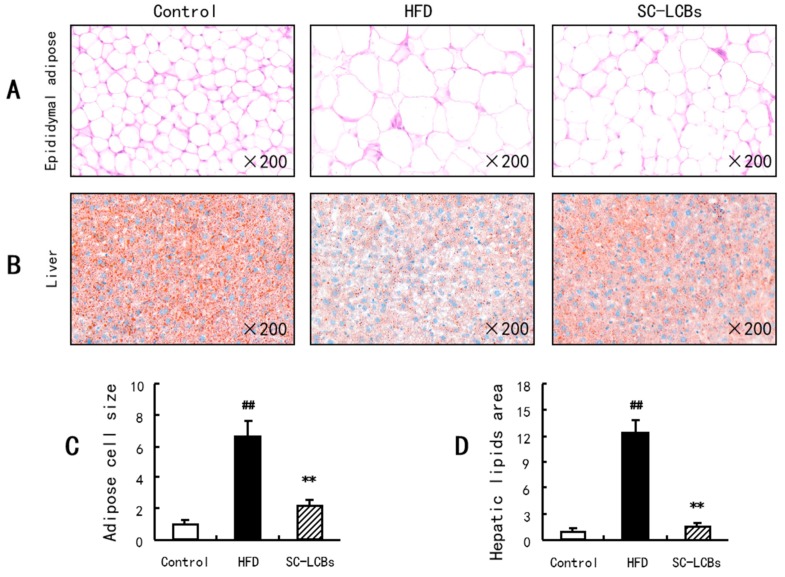
Figure 2.
Effects of SC-LCBs on the histology of adipose and liver tissues using H&E staining (×200, n = 10). The adipose cell size and hepatic lipids area were measured by CaseViewer 2.0, and the size or area of the control was defined as 1. (A), H&E staining to epididymal adipose; (B), H&E staining to liver; (C), adipose cell size, the bars means the quantized values for each groups in (A); (D), hepatic lipids area, the bars means the quantized values for each groups in B. The difference between the control and HFD mice, between HFD and SC-LCBs groups was analyzed using Student’s test. ## P < 0.01 vs. control; ** P < 0.01 vs. HFD.

