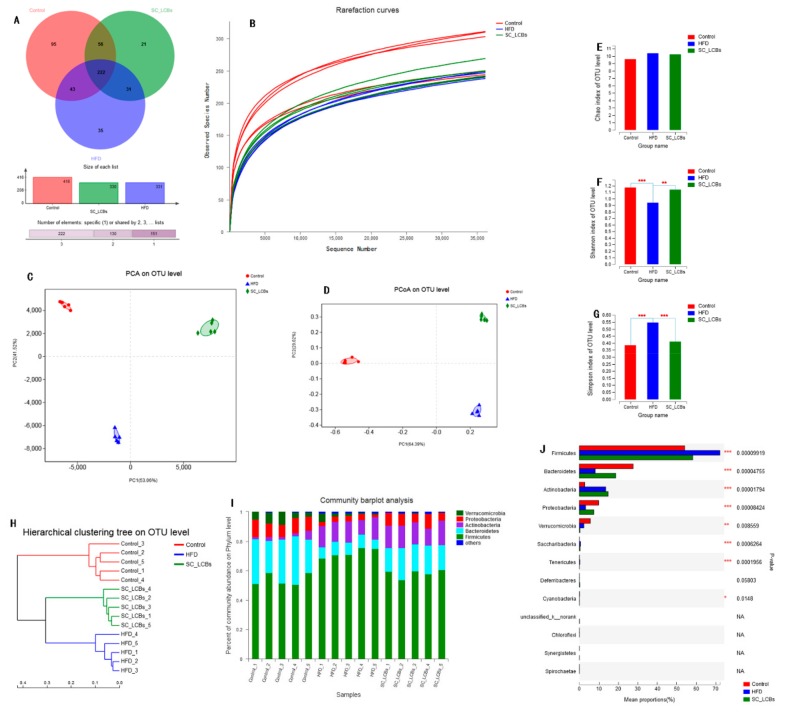
Figure 3.
Effects of SC-LCBs on the composition of the gut microbiota in HFD mice (n = 5). (A), Vean diagram; (B), rarefaction curves; (C), PCA on OTU level; (D), PCoA on OTU level; (E), chao index; (F), shannon index; (G), simpon index; (H), hierarchical clustering tree on OTU level; (I), community barplot analysis fro each sample; J, bacteria at phylum level for each group. Univariate differential abundance of OTUs at the Phylum level was tested by incorporating Fisher’s exact test and the false discovery rate (FDR) among control, HFD, and SC-LCBs groups and between mouse genotypes. P values were corrected with the Benjamini-Hochberg method to correct for the false discovery rate across multiple comparisons, which were generated using Metastats and considered significance at p < 0.05. The difference between the control and HFD mice, between HFD and SC-LCBs groups was analyzed using Student’s test. * p < 0.05, ** p < 0.01 *** p < 0.001 vs. HFD.

