Figure 3.
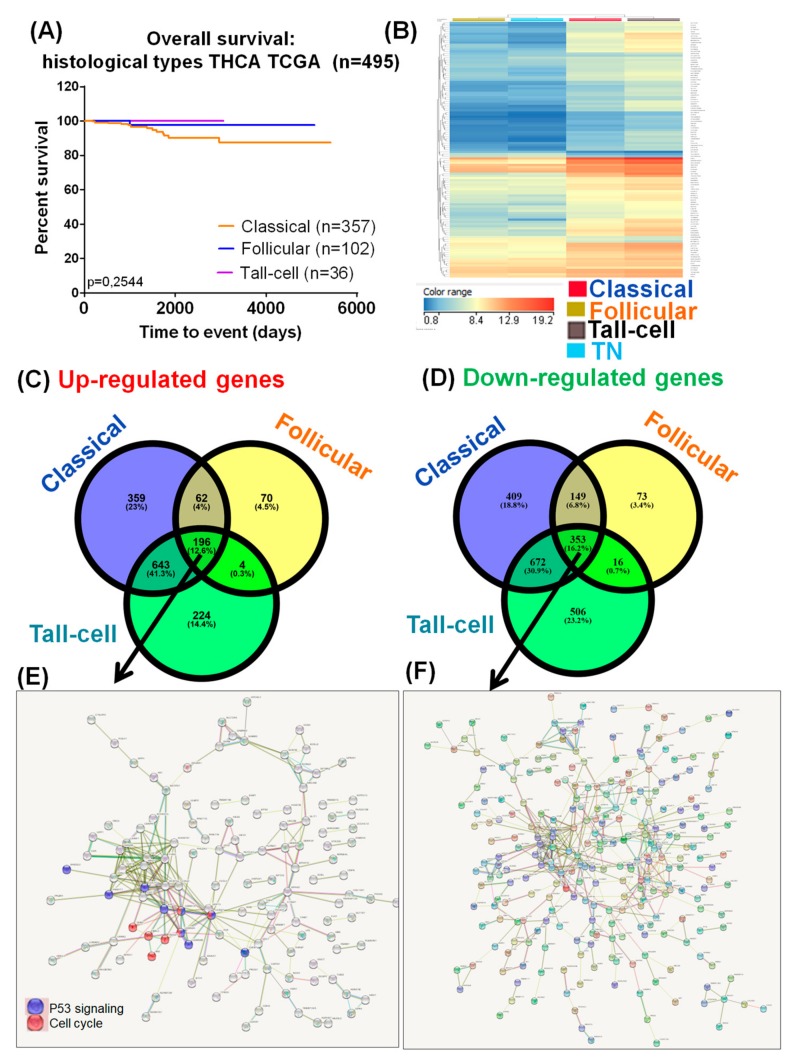
Molecular portrait of thyroid cancer. (A) Kaplan–Meier survival analysis, categorized by the main 3 types of papillary thyroid cancer; (B) Heatmap for specific altered genes for the three selected groups versus TN (normal thyroid tissue), considering p-value 1 × 10⁻³⁰; (C,D) Venn diagram for identifying common and specific upregulated or downregulated genes in each subtype of PTC; (E) String network for the common 196 overexpressed genes; (F) String network for the common 353 downregulated genes.

