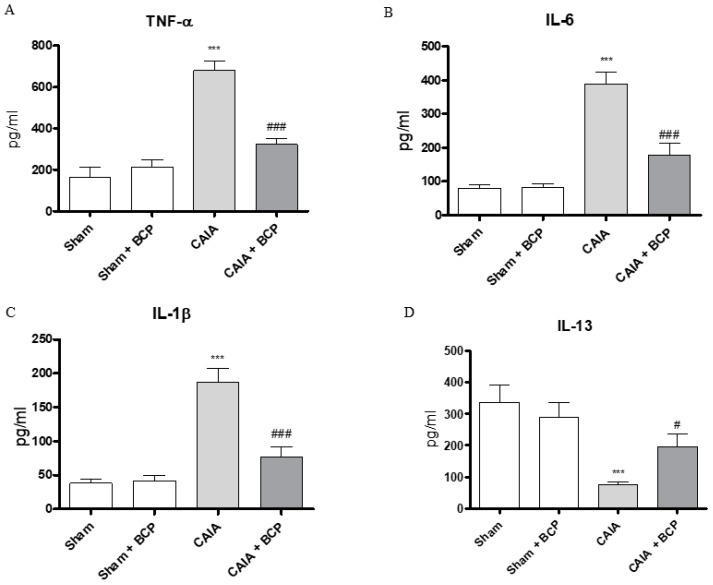
Figure 3.
The graphs represent the levels of TNF-α (A), IL-6 (B), IL-1β (C), and IL-13 (D) in serum collected from each group at day 15. Levels of cytokines were studied by enzyme linked immunosorbent assay (ELISA). Values shown are expressed as the means ± SD. *** p < 0.0001 vs. Sham and Sham + BCP; ### p < 0.0001 and # p < 0.05 vs. CAIA.

