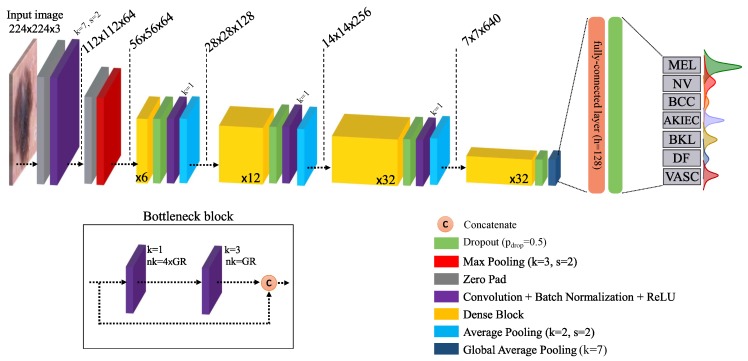
Figure 2.
Schematic of the Bayesian DenseNet-169 architecture. The diagram shows the entire pipeline for the system which is trained end-to-end. Instead of a single scalar, Bayesian network outputs a predictive distribution per class whose mean and dispersion represents the network prediction and uncertainty, respectively. The number in the dense blocks corresponds to the number of bottleneck block within that dense block. k: kernel size, s: stride, : number of convolutional kernels, : growth rate [59].

