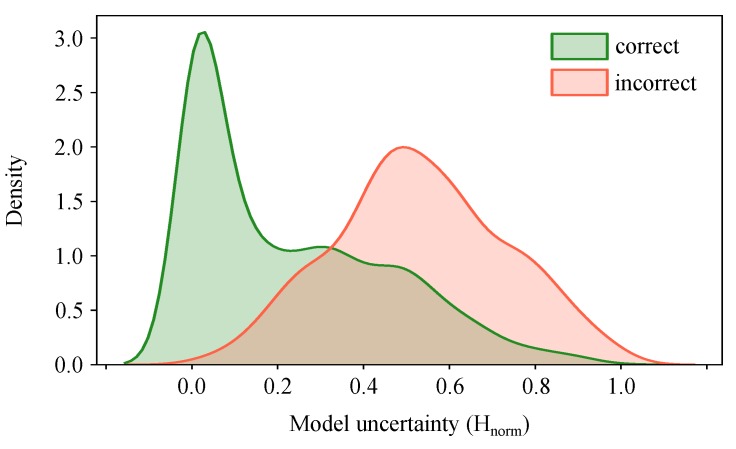
Figure 6.
Distribution of normalized uncertainty values () for all test samples grouped as correct and incorrect predictions. It shows that model uncertainty is higher for incorrect predictions. Therefore, it serves as complementary information to refer the uncertain samples to experts and improve the overall prediction performance of the automated system. Kernel density estimation with a Gaussian kernel is used to plot the output posterior distributions.

