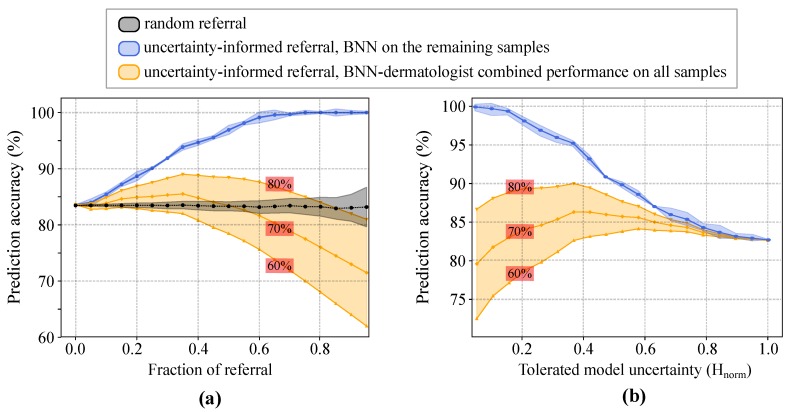
Figure 8.
Enhanced prediction accuracy of physician–machine team via uncertainty-aware referral. (a) The classification accuracy as a function of the fraction of referral. The black curve shows the effect of rejecting the same number of samples randomly (i.e., with no use of uncertainty information). (b) The classification accuracy as a function of the tolerated amount of normalized model uncertainty. The shaded areas around the blue and black curves show one standard deviation for the five-fold cross-validation. For the BNN–dermatologist curves (shown in orange), the corresponding stand-alone performance of the dermatologist is shown in the red box on each curve.

