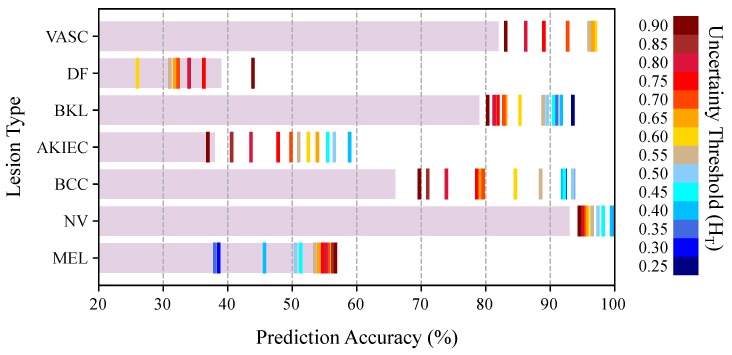
Figure 9.
Prediction accuracy of the Bayesian DenseNet-169 model for various skin lesions as a function of the uncertainty threshold (). The horizontal bars represent the performance of the Bayesian network on all test samples (no referral). The colored vertical lines depict the classification performance for each lesion at a specific uncertainty threshold.

