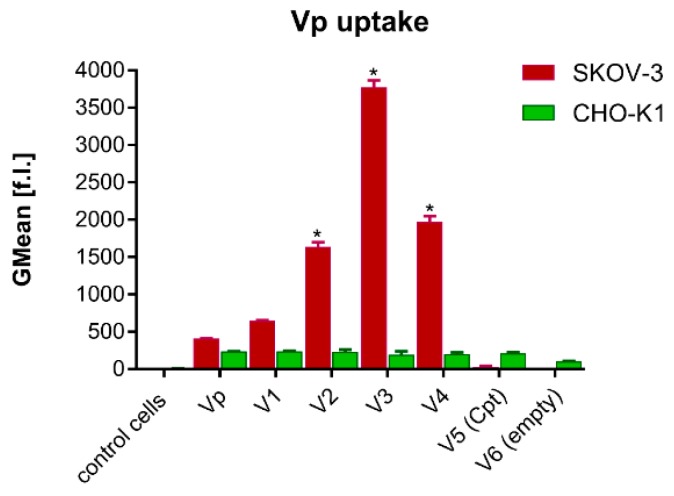
Figure 4.
Influence of the nanocarrier surface on the encapsulated cargo uptake by SKOV-3 and CHO-K1 cells evaluated by flow cytometry analysis. The uptake of NCs was expressed as mean fluorescence intensity of VP in the gated cell population after 24 h incubation of cells with the loaded PLGA NCs (V1–V5), control cells (control), empty nanocarriers (V6). and free VP (Vp). See descriptions of the systems in Table 1.

