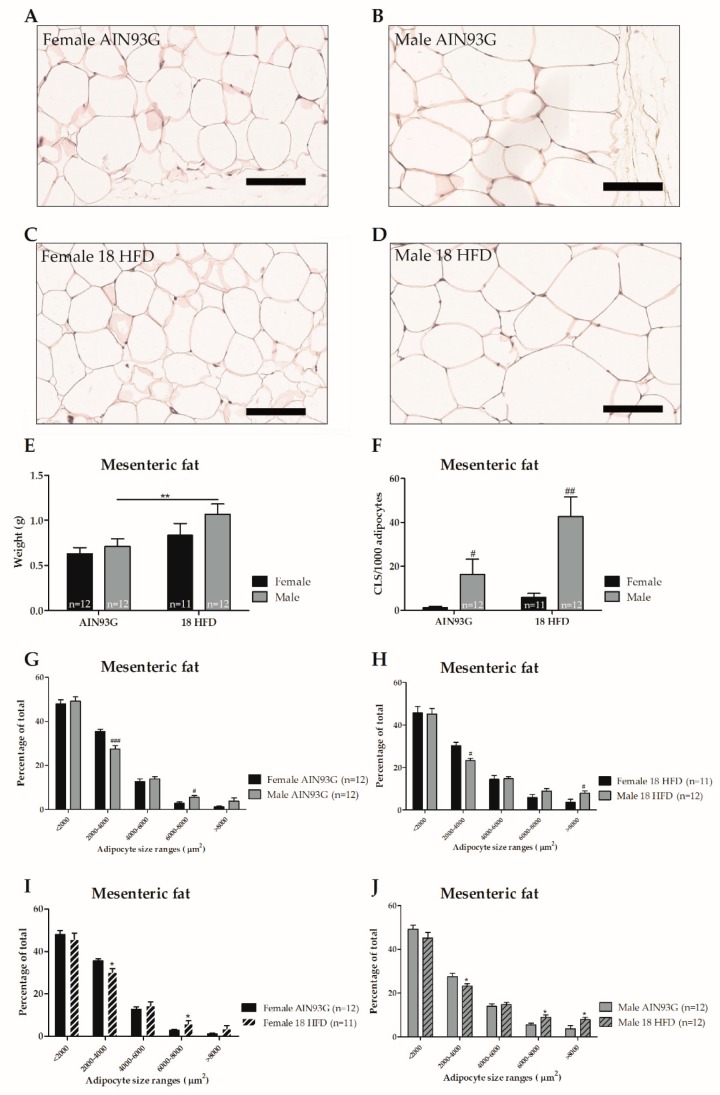
Figure 4.
Adipose tissue analysis in Ldlr-/-.Leiden mice after 18 weeks of AIN93G diet or HFD feeding. Representative photomicrographs of haematoxylin phloxine and saffron (HPS) stained mesenteric adipose tissue per experimental group (A–D). Scale bar is 100 µm. Analyses of weight (E) and level of inflammation as indicated by crown-like structures (CLS) per 1000 adipocytes (F) in the mesenteric fat depot. Distribution of adipocyte sizes for either AIN93G diet (G), HFD diet (H) or sex: female (I) and male (J). Significant dietary effects * p ≤ 0.050 and ** p ≤ 0.010. Significant effects in sex # p ≤ 0.050 and ### p ≤ 0.001.

