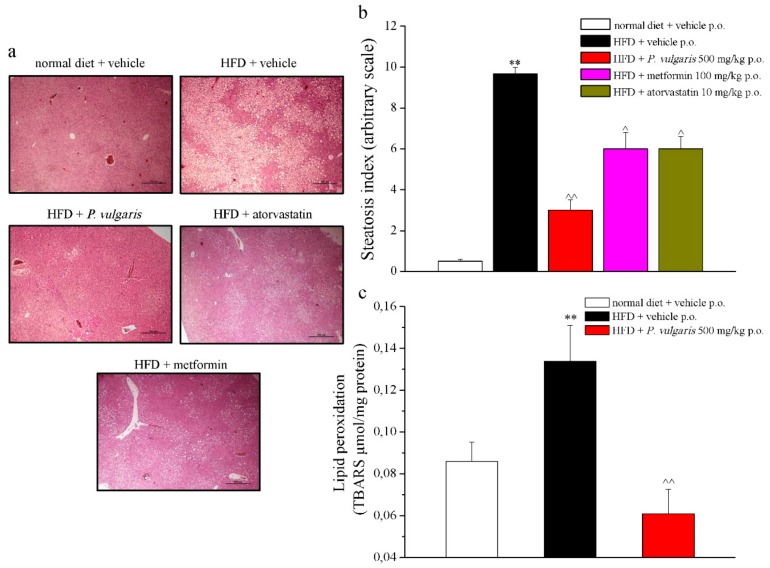
Figure 6.
Liver damage parameters. (a) Representative images of paraffin-embedded liver sections (5 µm thickness), stained with hematoxyllin-eosin, 4X magnificated. (b) Quantitative expression of steatosis index (graded ‘0’ to ‘10’ based on the average percent of fat-accumulated, 0 <5%, 10 >75%). (c) Oxidative alteration. Lipid peroxidation was evaluated measuring TBARS (μmol/mg protein). Week 19. Each value represents the mean ± S.E.M. of 12 mice per group. ** p < 0.01 vs. normal diet + vehicle; ^ p < 0.05 and ^^ p < 0.01 vs. HFD + vehicle.

