Figure 8.
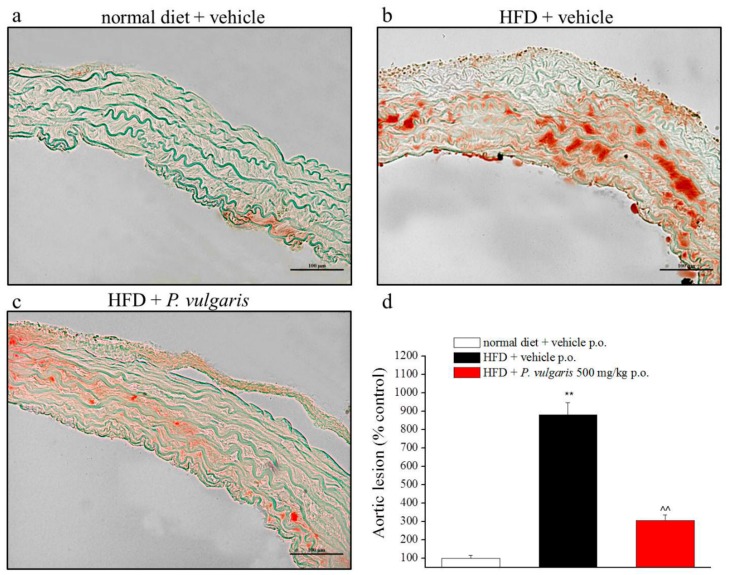
Vascular damage. (a–d) Evaluation of fatty streak infiltrations in aortic tissue of animals an week 19. (a,b,d) Representative images of aortic arch sections stained with Oil-Red O, 20X magnificated. (d) Quantitative determination of lesion extension, calculated as the positive area in comparison to the total cross-sectional vessel wall area. Aortic damage is expressed as percentage in comparison to control samples (set as 100%). ** p < 0.01 vs. normal diet + vehicle; ^^ p < 0.01 vs. HFD + vehicle.

