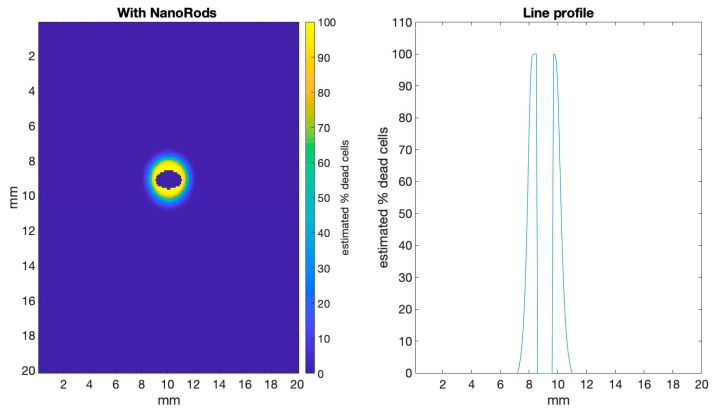
Figure 6.
Shows the same data as in Figure 5 (bottom panel) but with the tumour region masked, so that the damage to normal tissue can be more easily visualized. The line profile, with the tumour data removed, clearly shows that normal tissue ~1 mm around the tumour receives a dose where close to 100% of the cells are estimated to die.

