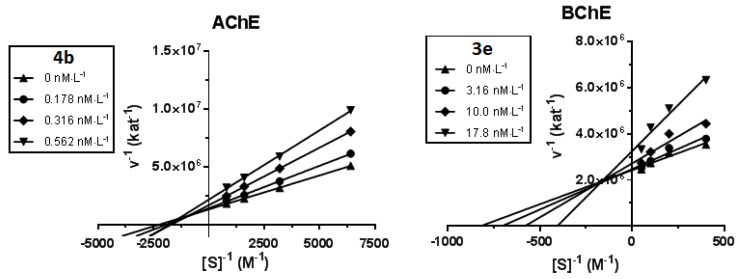
Figure 2.
Steady state inhibition of cholinesterase substrate hydrolysis by compound 4b (hAChE) and 3e (hBChE) at different concentrations. Lineweaver−Burk plots of initial velocity at increasing substrate concentrations (AChE: 0.1563–1.250 mM; BChE: 2.5–20.0 mM) are presented. Lines were derived from a linear regression of the data points.

