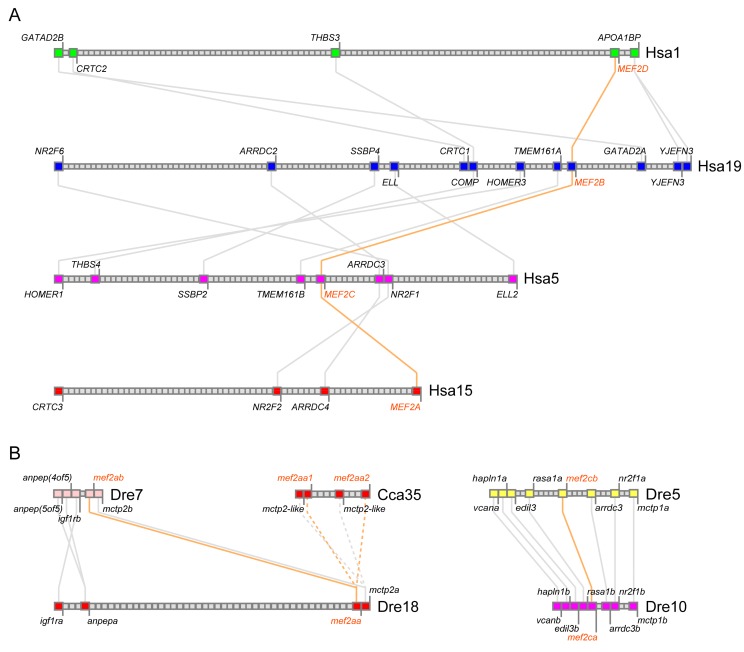
Figure 3.
Conserved synteny analysis with mef2 genes of Homo sapiens (A), Danio rerio and Cyprinus carpio (B). In each species, squares of the same color represent genes belonging to a syntenic cluster, with gene names indicated beside. Species and chromosome number are labeled on the right of each cluster (Hsa: H. sapiens; Dre: D. rerio; Cca: C. carpio). Solid and dashed lines connect paralogous and orthologous gene pairs, respectively. For simplicity, lines between Hsa1 and Hsa5, Hsa1 and Hsa15, as well as Hsa19 and Hsa15 are not shown. All mef2 genes and their connections are highlighted in orange.

