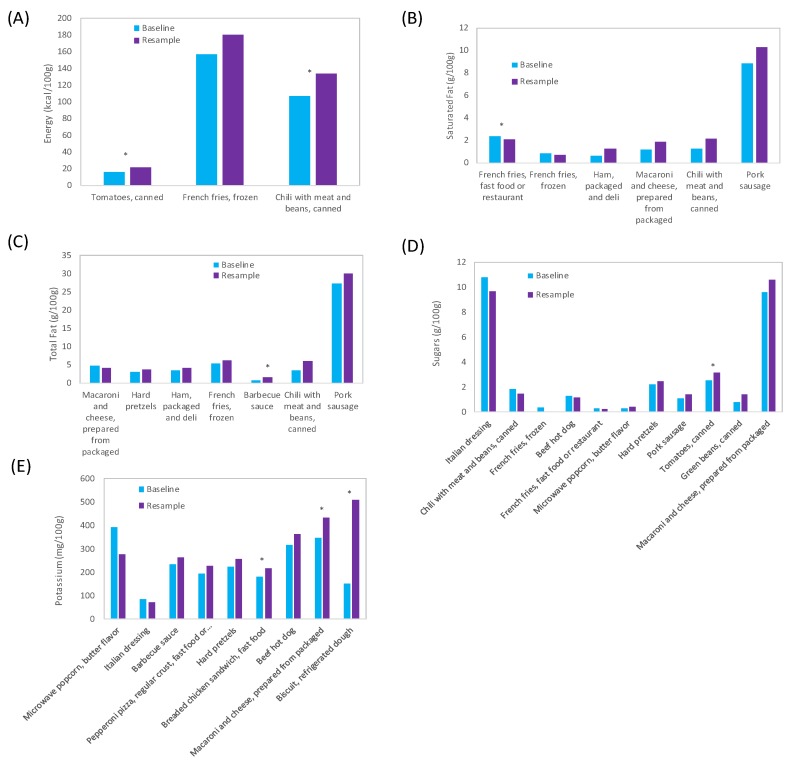
Figure 3.
Resampled Sentinel Foods with changes of at least ±10% in sales-weighted sodium and related nutrients: (A) energy, (B) saturated fat, (C) total fat (excludes foods < 1 g per 100 g), (D) sugar, and (E) Potassium since baseline. Baseline Sentinel Foods were sampled in 2010–2013, and then resampled in 2014–2017. *: p < 0.05.

