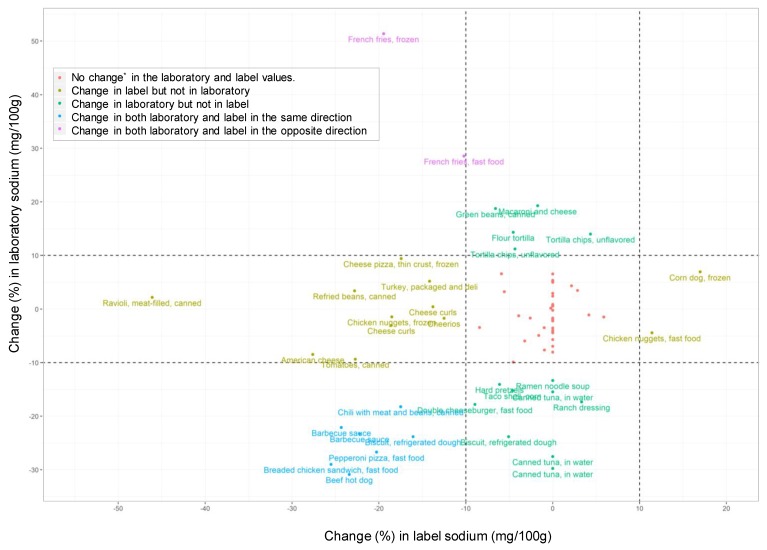
Figure 5.
Comparison of changes (%) in the label and mean laboratory sodium (mg per 100 g) by brand (n = 70); * Change is defined as at least ±10% change in sodium content from baseline. To make the figure easy to read, product descriptions were shortened, and not added for products with no change in laboratory and label values (in red). Each observation represents a brand; hence, some descriptions may be repeated.

