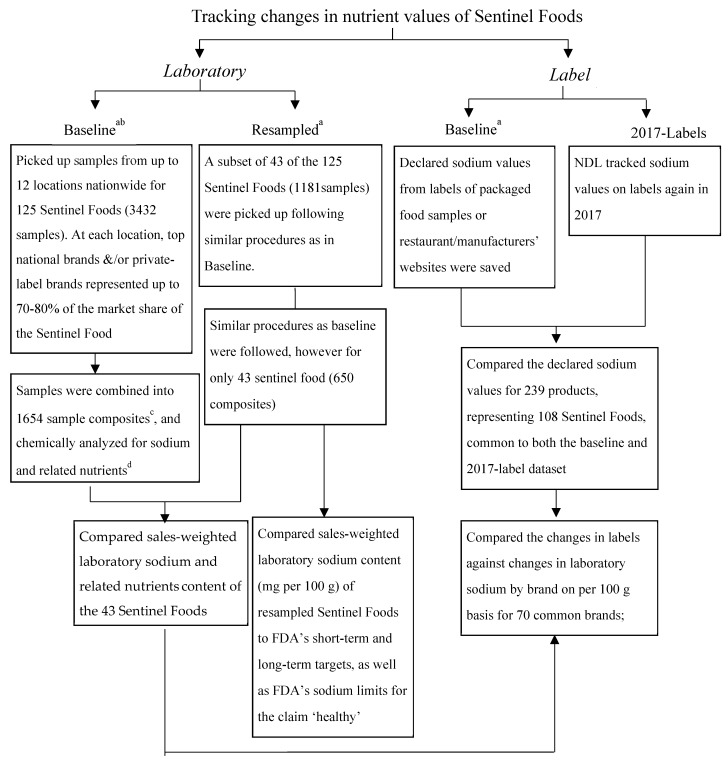
Scheme 1.
Summary of the steps, methods, and sample sizes used for tracking changes in nutrient values, as a flow chart. a Baseline Sentinel Foods were sampled in 2010–2013 and resampled in 2014–2017. b Please see Reference [20] for details on sampling plan and chemical analysis methodology. c Composite-homogenized one or more samples of the same food. d Related nutrients studied-energy, potassium, total and saturated fat, and total sugar.

