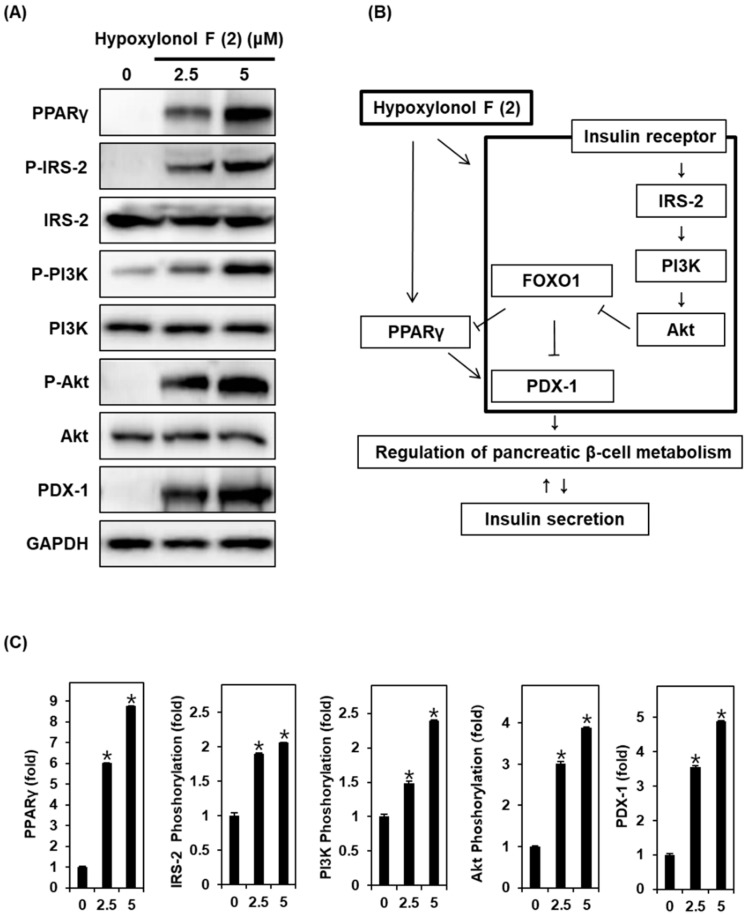
Figure 4.
Effect of hypoxylonol F (2) on the protein expression levels of peroxisome proliferator-activated receptor γ (PPARγ), P-IRS-2, insulin receptor substrate-2 (IRS-2), P-PI3K, PI3K, P-Akt (Ser473), Akt, and pancreatic and duodenal homeobox 1 (PDX-1) in INS-1 cells. (A) Protein expression levels of PPARγ, P-IRS-2, IRS-2, P-PI3K, PI3K, P-Akt (Ser473), Akt, PDX-1, and GAPDH in INS-1 cells treated or untreated with 2.5 μM and 5 μM hypoxylonol F (2) for 24 h. (B) Schematic illustration of effects of hypoxylonol F (2) on the protein expression levels of PPARγ, P-IRS-2, IRS-2, P-PI3K, PI3K, P-Akt (Ser473), Akt, and PDX-1 in INS-1 cells. (C) Each bar graphs presents the densitometric quantification of Western blot bands. * p < 0.05 compared with control (0 μM).

