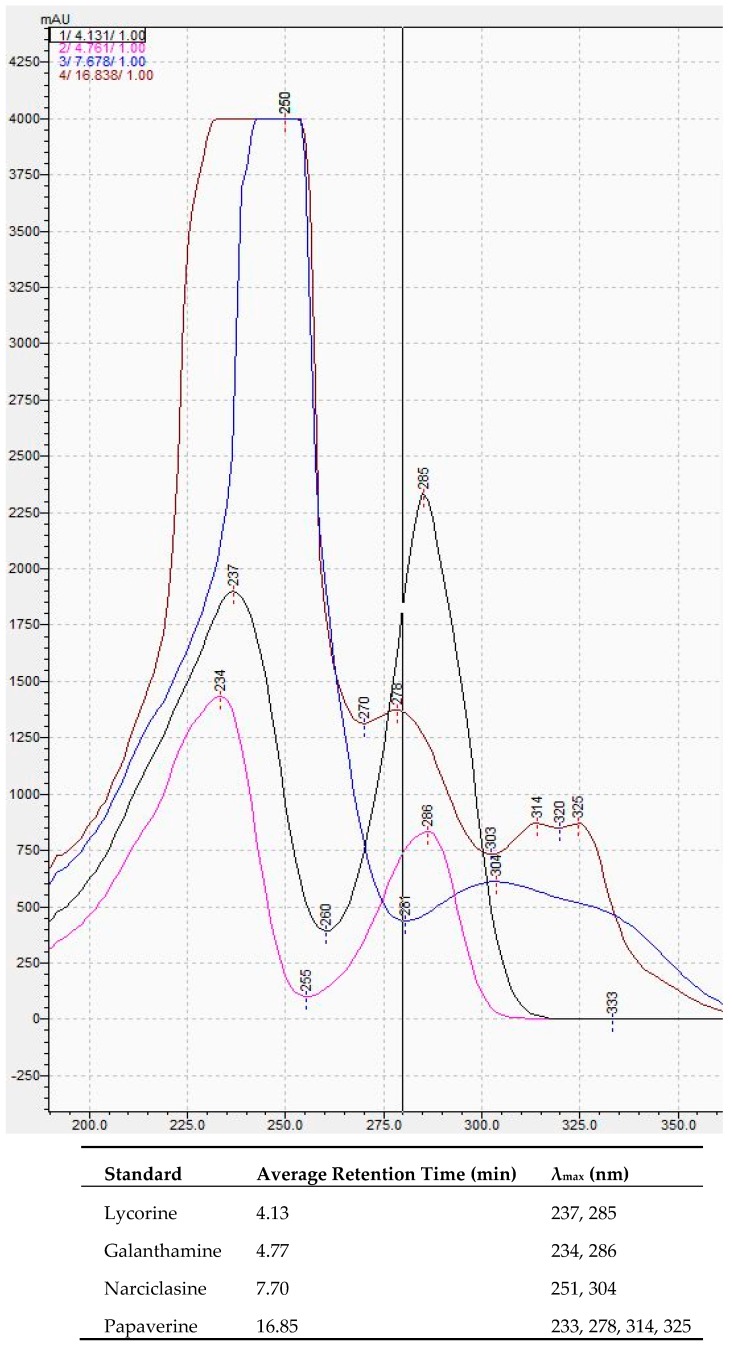
Figure A1.
HPLC analysis of alkaloid standards. The chromatogram shows the absorption spectrum of each alkaloid standard. The average retention time and absorption maxima of each alkaloid standard obtained by HPLC-PDA analysis are summarized in the Table A3.

