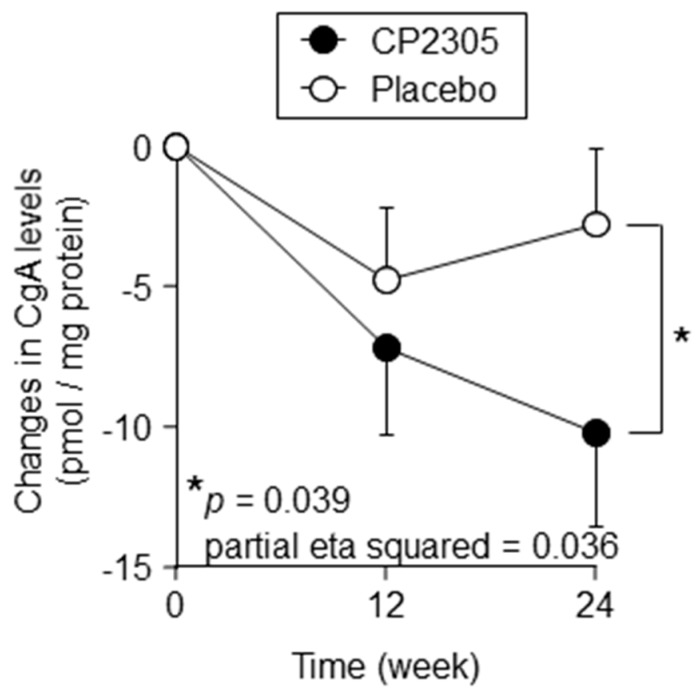
Figure 2.
Effects of CP2305 on time-dependent changes in salivary chromogranin A (CgA) levels. Saliva was collected at a constant time within 3 days before and 12 or 24 weeks after the intervention start. Data are presented as the mean ± SEM. Black circles are indicative of CP2305 and the white circles of placebo. Data were analyzed by repeated-measures ANOVA between the groups without multiple comparison correction. p and partial eta squared values are shown in the panel. Asterisks indicate overall significance between the groups across time points. * p < 0.05.

