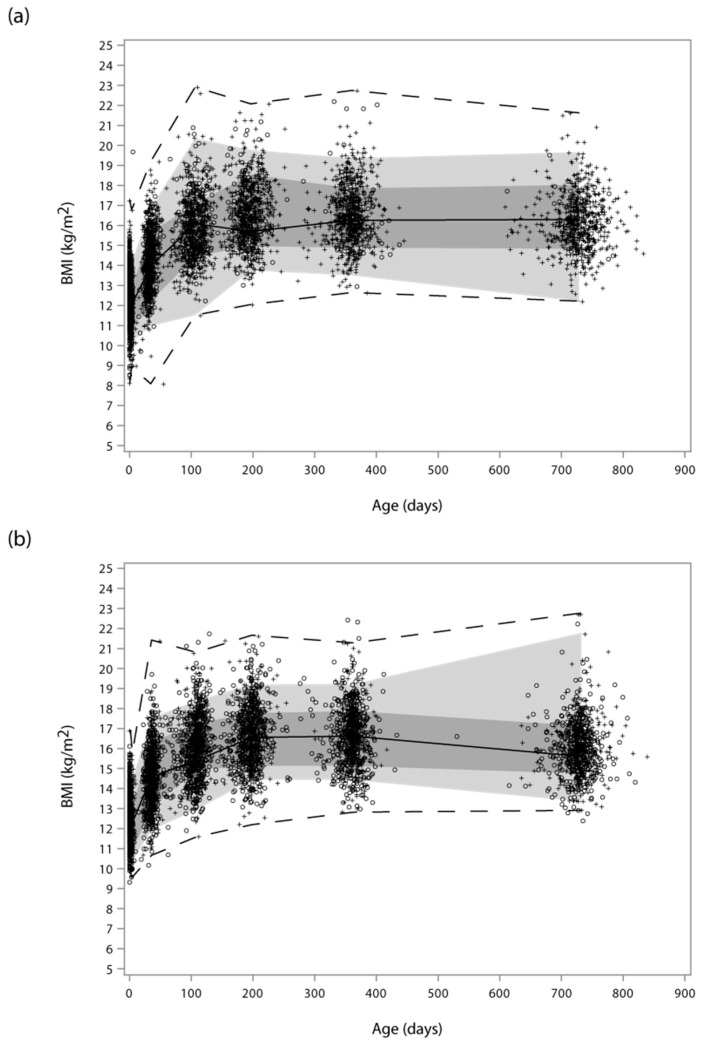
Figure 1.
Functional boxplot of child body mass index (BMI) across ages at measure overlaid with scatter plots at each age in the SPATZ (a) and UBCS (b) cohorts. Scatter plots represent children with complete (+) BMI data used to calculate the functional boxplot and children with incomplete (O) data at one or more measurement periods. (Measurement periods were each collapsed to the average measurement period time for functional boxplot calculation, which is why the functional boxplots exhibit kinks at the center age of each scatter and end at the center age (approximately 750 days) of the last measurement. The solid black line represents the median curve of the functional boxplot. The dark and light grey bands are the central 10% and 50% regions, respectively; the latter corresponding to the interquartile range in a usual boxplot. The dashed lines indicate the nonoutlying envelopes determined by the 1.5 times the 50% central region rule (like the whiskers in a usual boxplot), which in both images correspond to the minimum and maximum since no outliers were detected.).

