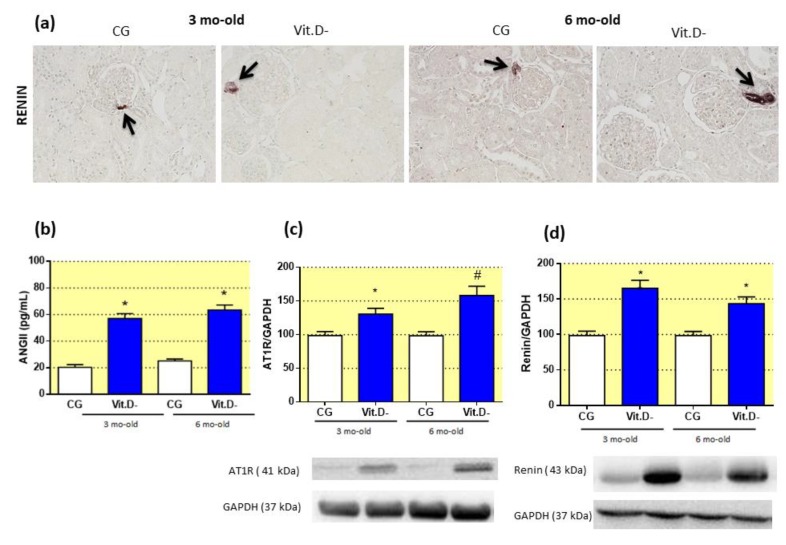
Figure 2.
Effects of Vitamin D (Vit.D) deficiency on renin expression, plasma angiotensin (ANGII) and angiotensin II receptor type 1 (AT1) expression. (a) Representative images of renal cortex sections from all groups stained for renin (CG n = 5, Vit.D- n = 5). Arrows indicate the afferent glomerular arterioles in the JG region. Bar = 50 μm. (b) The plasma ANGII concentrations in all groups (control group (CG) n = 9, Vit.D- n = 11). (c) Western blot analysis of renal tissues from all groups for AT1 expression (CG n = 4, Vit.D- n = 4). (d) Western blot analysis of renal tissue from all groups for renin expression (CG n = 4, Vit.D- n = 4). The densitometric ratio between the densitometries of the AT1 receptor, renin and glyceraldehyde 3-phosphate dehydrogenase (GAPDH) was calculated, and the data are expressed relative to the control, with the mean (±SEM) control value designated as 100%. Blots are representative images from independent experiments. Bar = 50 μm. * p < 0.05 compared with controls of the same age.

