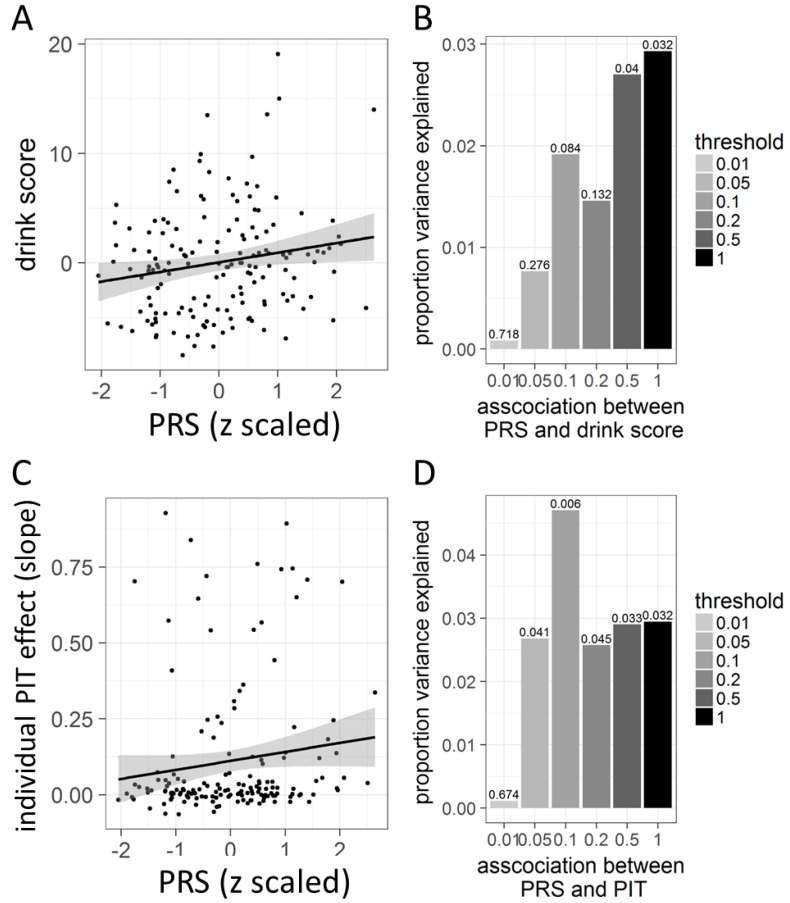
Figure 5.
Polygenic risk score (PRS) for alcohol consumption in association with alcohol intake and PIT in our sample (n = 157). (A): Association between PRS and alcohol intake as measured by the drink score in our sample. (B): Explained variance of the association between PRS and drink score as indicated by rs2 for each threshold. Values at each bar represent the p-values, tested two-tailed. (C): Association between PRS and behavioral PIT effect slope. (D): Explained variance of the association between PRS and behavioral PIT slope as indicated by rs2 for each threshold. Values at each bar represent the p-values, tested two-tailed.

