Figure 6.
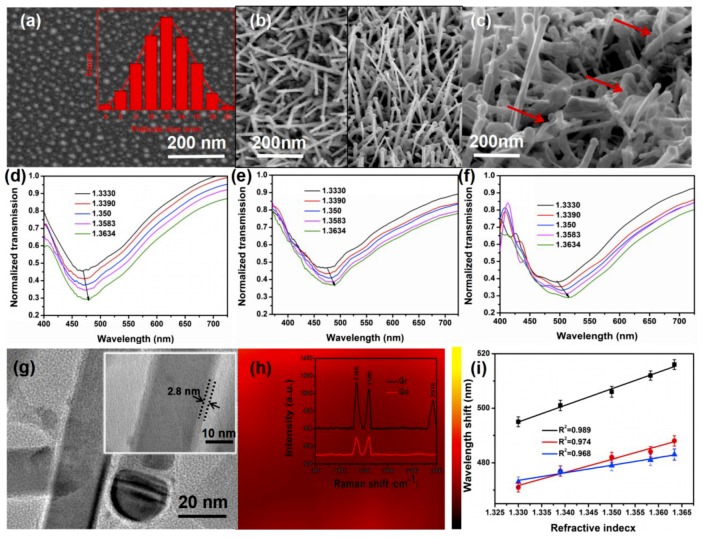
(a) Distribution of annealed Au particles. (b) Frontal profile of ITO (right figure shows the ITO with the preannealing process and the left exactly the opposite). (c) Surface morphology of Gr/ITO-NM/U-bent-A/0.04/20. (d–f) The absorption spectra of ITO-NM/U-bent/0.04/20, ITO-NM/U-bent-A/0.04/20, Gr/ITO-NM/U-bent-A/0.04/20 sensors in alcohol solution with RI from 1.3330 to 1.3634. (g) TEM diagram of Gr/ITO-NM/U-bent-A/0.04/20. (h) 2910 cm−1 peak mapping (20 × 20 μm2) of graphene and the insert pattern is Raman diagrams of graphene and graphene oxide on Gr/ITO-NM/U-bent-A/0.04/20 sensor. Figure S1 shows 15 groups of Raman spectra collected from different sensors. (i) The relationship between resonance wavelength and refractive index of ITO-NM/U-bent/0.04/20, ITO-NM/U-bent-A/0.04/20, and Gr/ITO-NM/U-bent-A/0.04/20.

