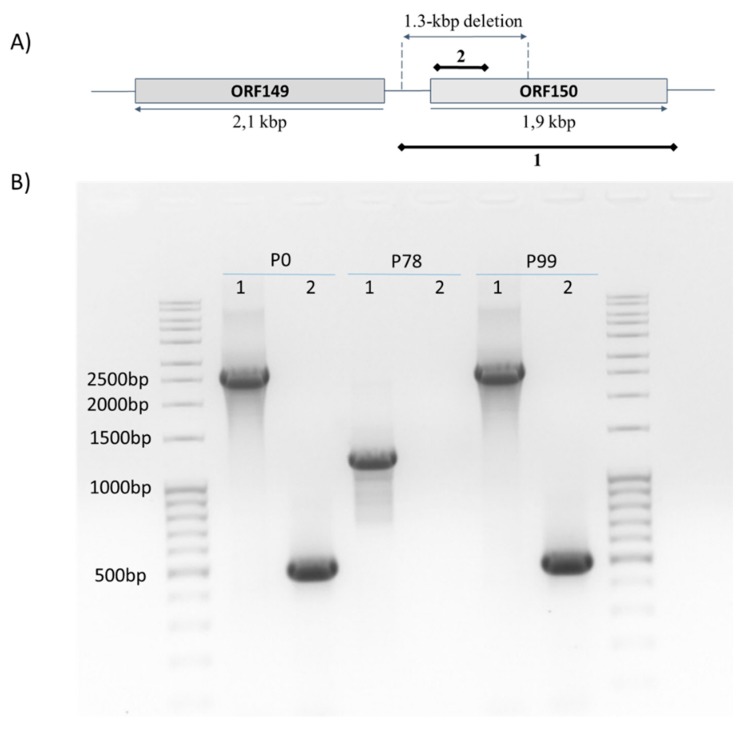
Figure 3.
PCR results using the primer set covering the whole ORF150 (1) and the primer set designed inside the deletion (2). (A) Schematic representation of the assay design. The expected amplicon sizes according to P0 are 2593 bp, and 500 bp using the two primer sets, respectively. (B) The two external lanes were loaded with a 100-bp molecular weight marker, and the corresponding sizes are indicated on the left. 1 and 2 refer to the primer pairs ORF150_-363_F / ORF150_+343_F and ORF150_11_F / ORF150_510_R, respectively (see Table 1).

