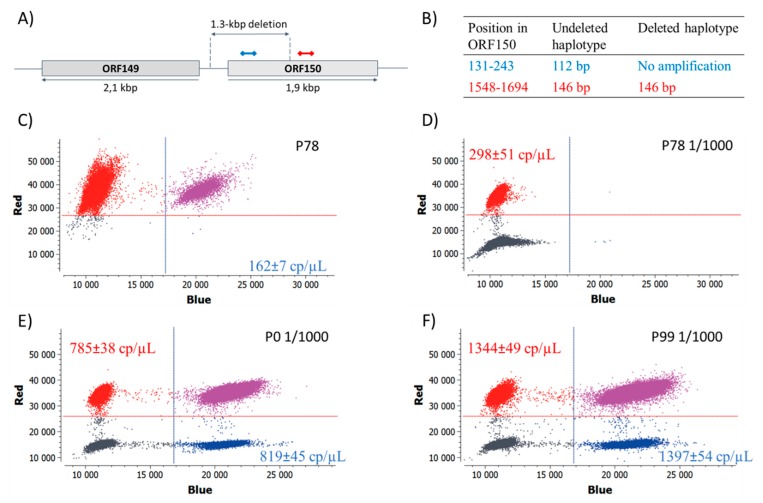
Figure 4.
Quantification of deleted and undeleted haplotypes by digital PCR. (A) Schematic representation of the assay design and, (B) expected amplification products. (C–F) Fluorescence intensities of all the partitions in the red and blue channels, and estimated concentrations of the corresponding amplicons (mean ± SD of 3 replicates, in copy/µL). The red channel reflects the concentration of both haplotypes, and the blue channel reflects the concentration of the undeleted haplotype only. Purple dots represent the partitions that are positive in both channels, and the grey dots correspond to negative partitions. Y and X axes represent the fluorescence intensity in the red, and blue channels, respectively.

