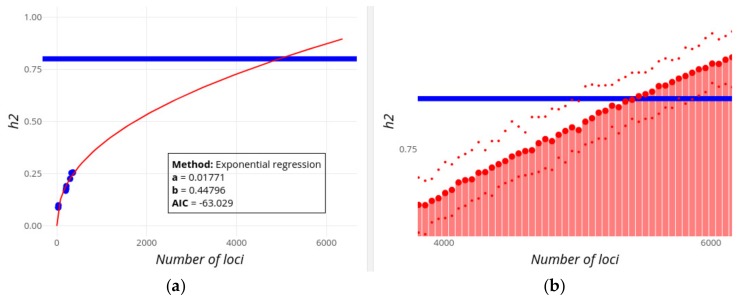
Figure 4.
Screenshot of GWEHS (Genome-Wide Effect size and Heritability Screener) showing the inferences on the increase of heritability (h2) as new loci are found for human Height, using the default parameters (up to 6,000 loci). (a) Inferences using a regression method of the change in heritability with the number of loci. Blue points indicate observed values from different sets of PMIDs. The red line corresponds to the regression fit. A text box includes the distribution parameters and the Akaike information criterion (AIC) value. (b) Inferences using a regression method on the parameters of the distribution of effect sizes and minor allele frequencies (MAF), and sampling heritability values. The blue line indicates the assumed familial heritability. The red bars correspond to the heritability sampled. The red points show the median (large point), and 0.975 and 0.025 quantiles of that heritability (upper and lower small points, respectively). Note that this image has been zoomed, which is one of the interactive utilities supported by the R Shiny package.

