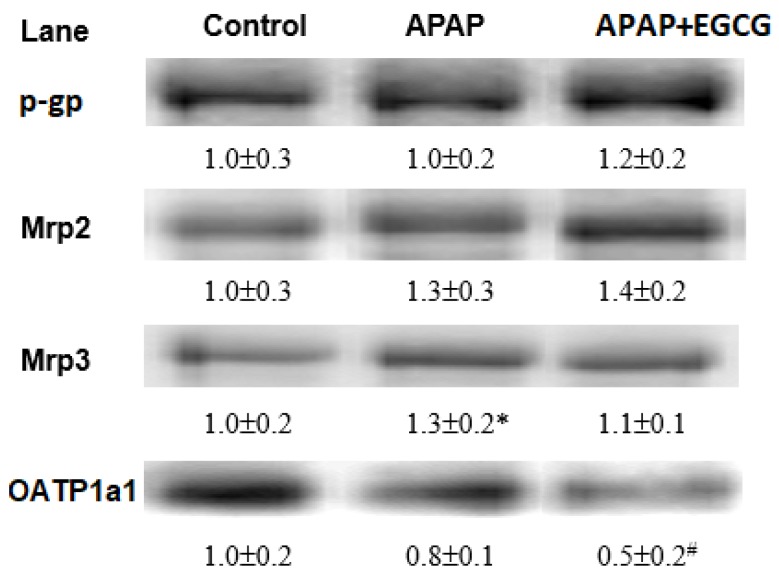
Figure 4.
Densitometry quantitation of Mrp2/3, p-gp, and OATP1a1 protein expression from rats fed an EGCG diet for four weeks and then treated with APAP for 12 h. Each lane represents the pooled (n = 5–6) liver membrane protein from an individual rat. The protein band was quantified by densitometry, and the level of the control was set to 1. * Significantly different from control group, p < 0.05. # Significantly different from APAP group, p < 0.05.

