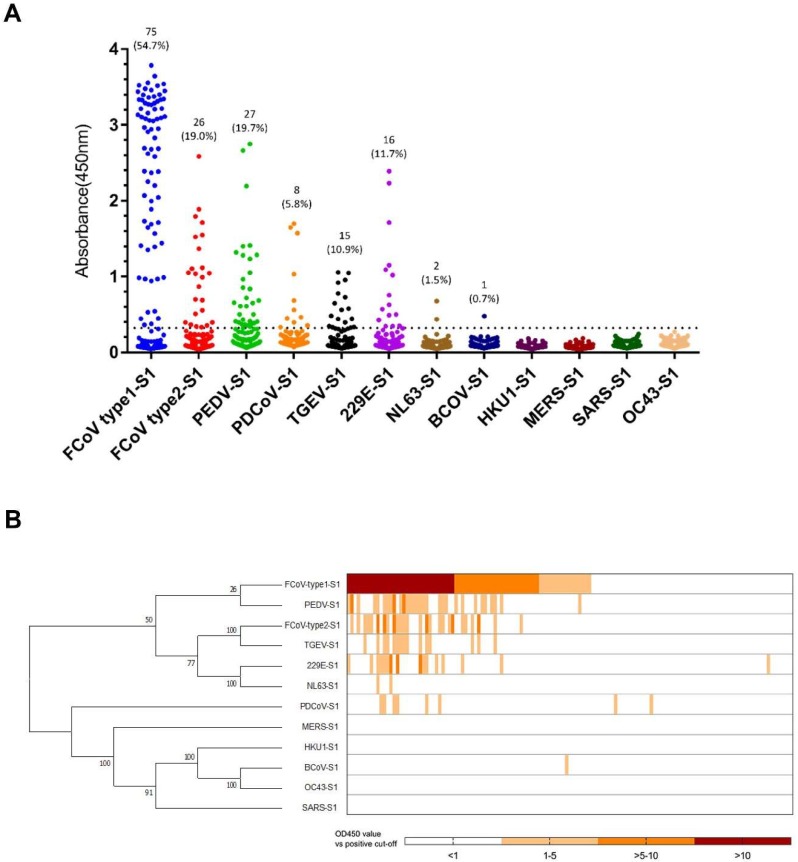
Figure 1.
ELISA-reactivity of feline serum samples against S1 proteins of different coronaviruses. (A) Reactivity of feline serum samples (n = 137) against 12 coronavirus S1 antigens was determined by ELISA. The number and percentage of seropositive samples are indicated for each S1 protein. The dashed line is the positive cut-off. Each dot represents one individual sample within each antigen panel. (B) Relative ELISA (OD450 values divided by cut-off value) results are displayed as a heat map. Different S1 antigens were grouped by amino acid sequence phylogeny (left panel) using MEGA7. Each column of the heat map represents an individual sample, and columns were arranged in a descending order based on ELISA-reactivity against feline coronavirus (FCoV) type 1.

