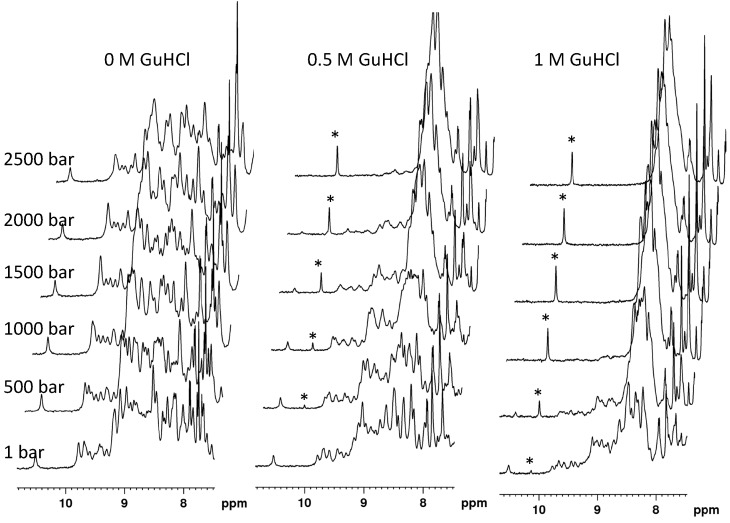
Figure 1.
Determination of the experimental conditions (guanidine concentration) for the denaturation study of DEN4-ED3. Stacked plot of 1D 1H spectra (amide region) recorded at variable pressure (from bottom to top) and variable concentration (0, 0.5, and 1 M, from left to right) of guanidine. Protein unfolding was monitored by following the rise of the indolic resonance of Trp103 in the unfolded state (indicated with an asterisk) and the concomitant decrease of the same resonance of Trp103 in the folded state (left: most resonance).

