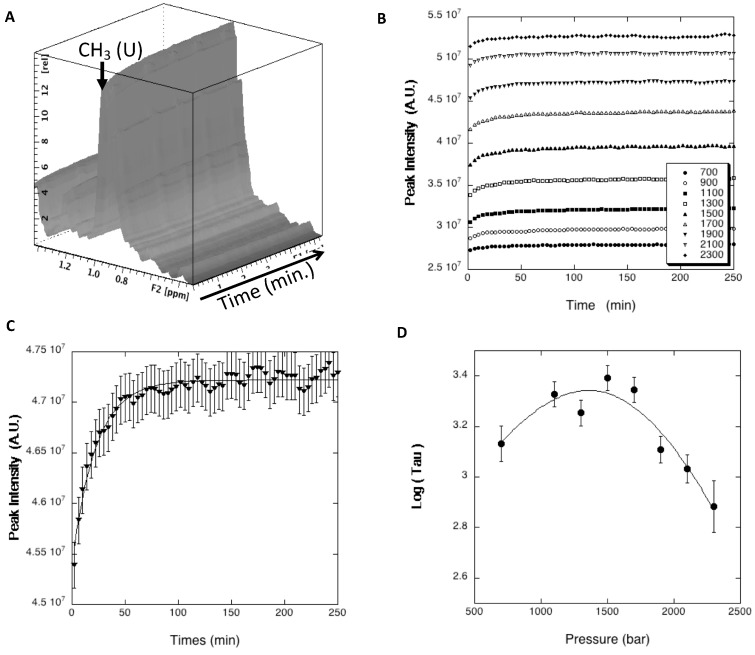
Figure 7.
P-jump experiments followed by high-pressure 1D proton NMR. (A) Stacked plot of the 1D proton NMR spectra recorded on DEN4-ED3 after a positive 200 bar P-jump (1700 to 1900 bar). Only the region of the methyl resonances is reported. The arrow indicates the resonance corresponding to unfolded methyl groups (CH3 (U)), used as a probe to measure the relaxation rates τ(p). (B) Time evolution of the unfolded methyl resonance (CH3 (U)) after positive 200 bar P-jumps realized between different pressures (final pressures are reported in the insert). (C) Example of fit obtained for the 1700 to 1900 P-jump: the data points were fitted with an exponential growth to obtain the values of τ. (D) The fit with Equation (3) of the chevron plot of log(τ) versus pressure allows extraction of the folding and unfolding global rate constants ku and kf, as well as the apparent global residue-specific activation volume of folding (∆Vf‡) (see Material and Methods).

