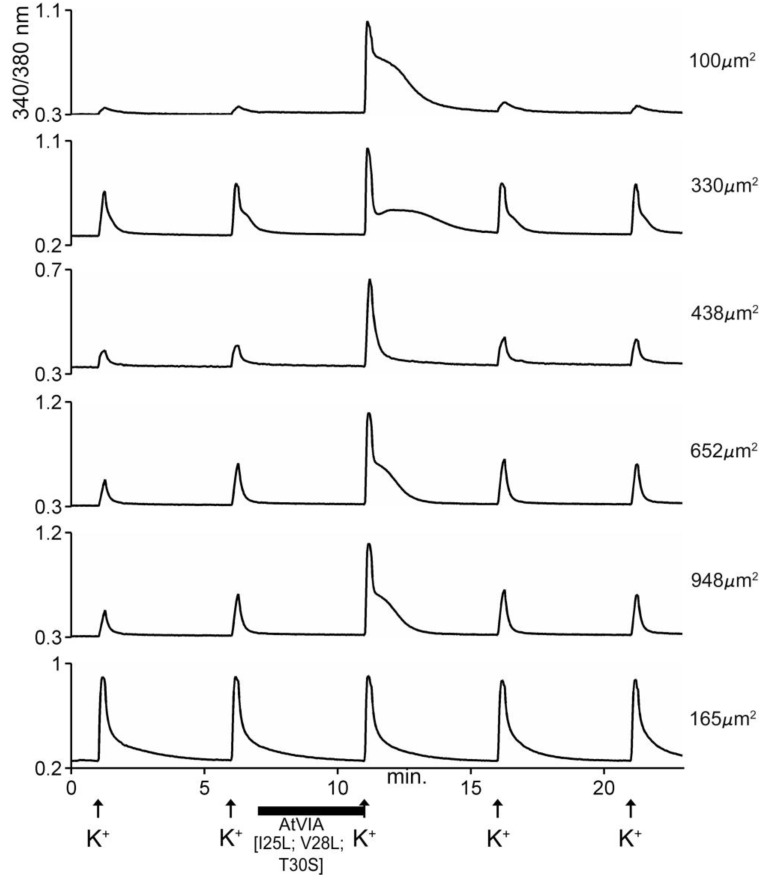
Figure 8.
Responses of 6 different cells to AtVIA[I25L;V28L;T30S]. Shown are the responses of 6 DRG neurons, with the size of each indicated. Pulses of 25mM KCl were applied as described under Methods; the horizontal bar indicates where the cells were incubated with the peptide. The first five traces (from top) show a change in response upon depolarization with KCl (~95% of neurons responded in this manner). The bottom trace shows a cell that did not respond (~5% of DRG neurons).

