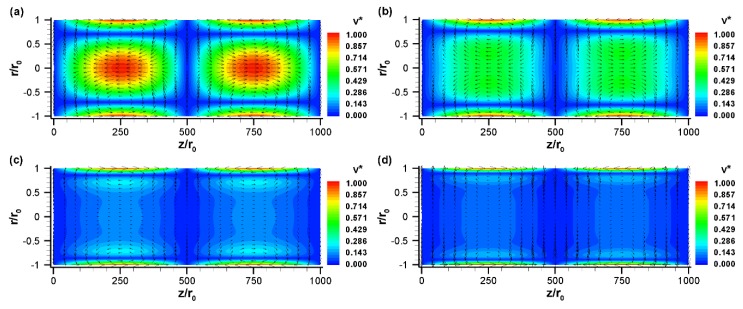
Figure 4.
The normalized velocity, (vector plot) and its magnitude, (contour plot) with a sinusoidal zeta potential distribution for various nondimensional frequencies: (a) , (b) , (c) , and (d) at . All other conditions are the same as those in Figure 3.

