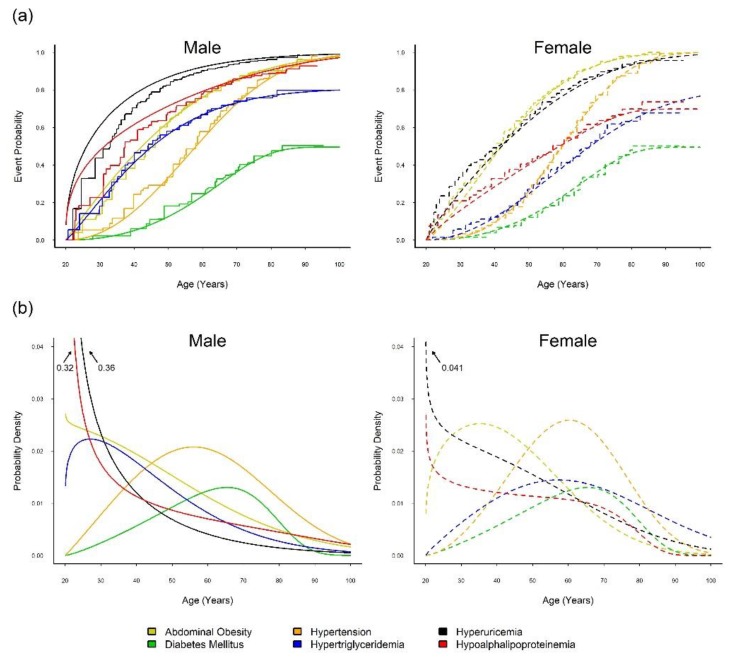
Figure 1.
Time-to-event curves and probability density curves of five metabolic syndrome (MetS) components and hyperuricemia. (a) Smooth and step event time curves, and (b) probability density curves, of five MetS components and hyperuricemia for male (solid line) and female (dashed line), estimated from the optimally fitted models of the Cardiovascular Disease Risk Factors Two-Township Study (CVDFACTS) in Taiwan, 1989–2002.

