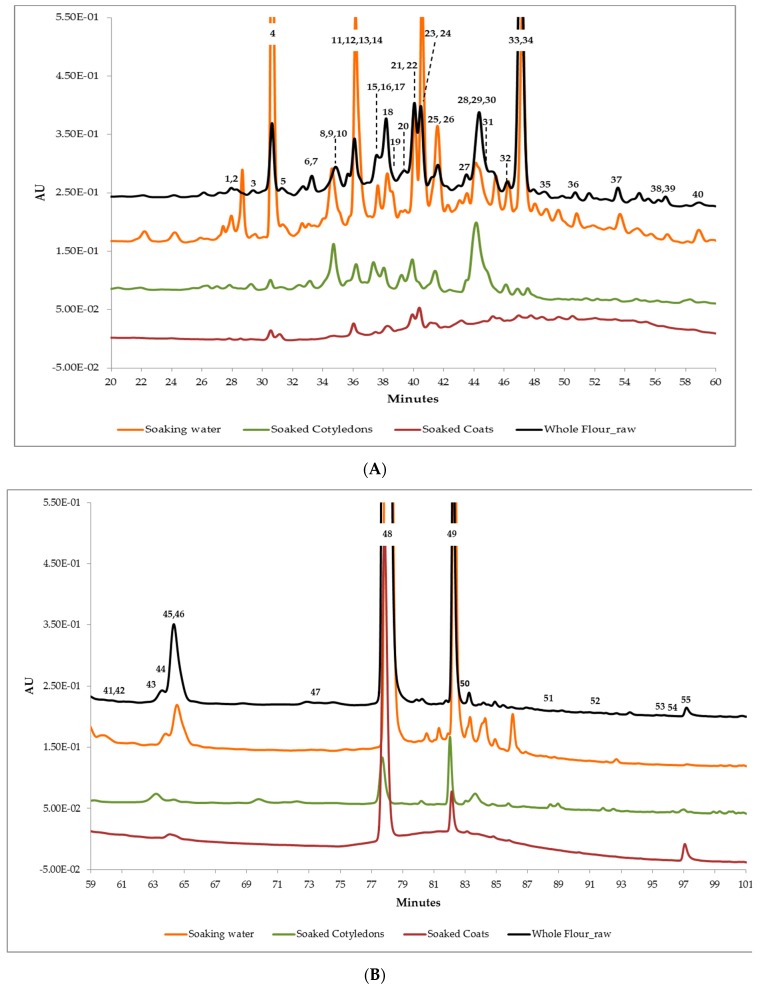
Figure 3.
(A) Zoom of the chromatographic profiles of sample’s 22 fractions (20–60 min) at 280 nm. The numbers highlight the identified compounds in Table 4. (B) Zoom of the chromatographic profiles of sample’s 22 fractions (59–101 min) at 280 nm. The numbers highlight the identified compounds in Table 4.

