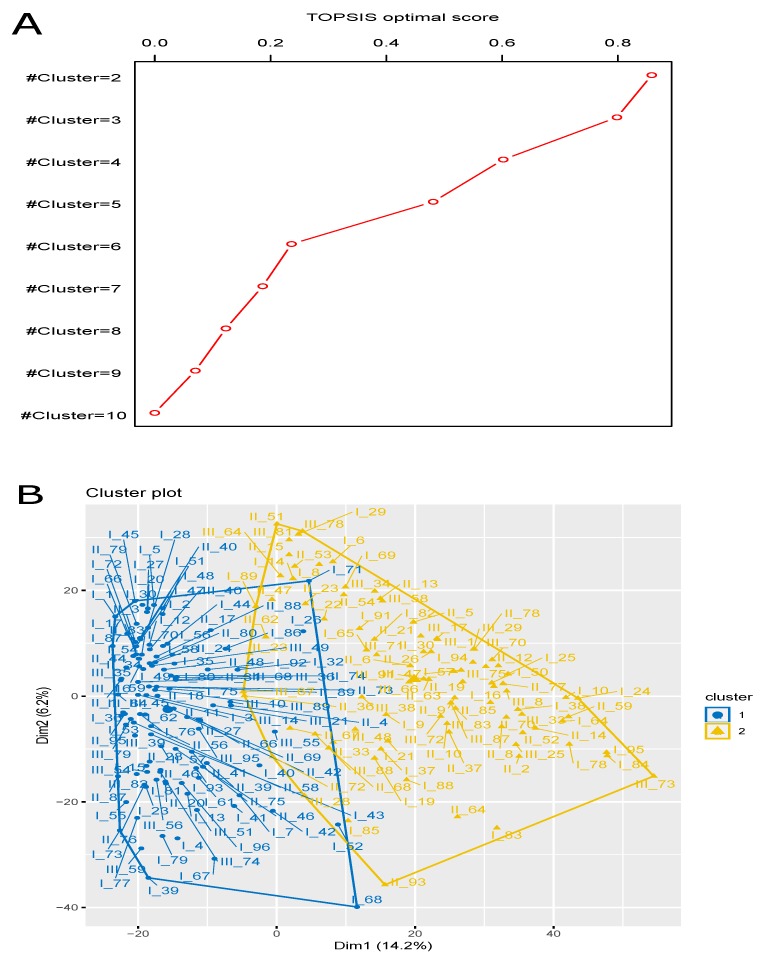
Figure 3.
Plots for multi-objective optimization and Principal Component Analysis (PCA). (A) Multi-objective optimization (TOPSIS) score for different cluster sizes (nine case studies: ) using Fuzzy c-means clustering. (B) The cluster plot (PCA plot) of the optimized fuzzy clustering along with their participating cells.

