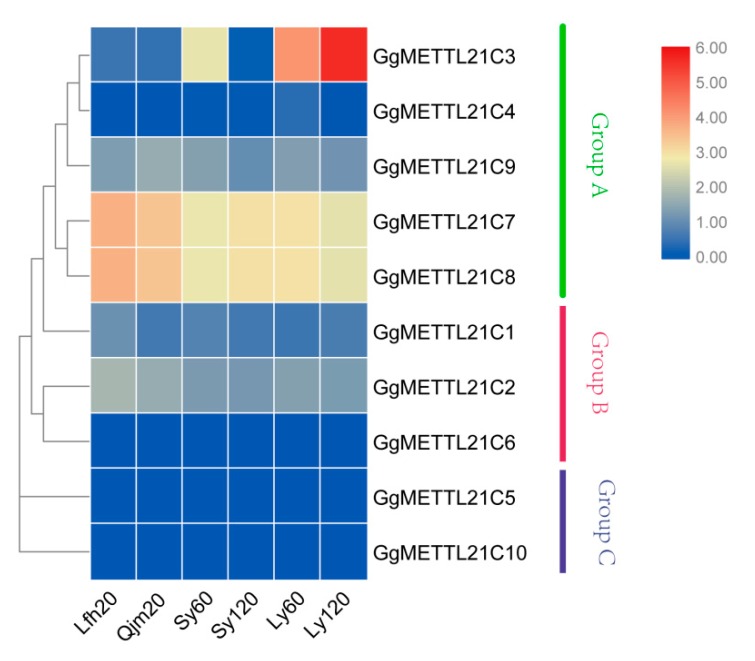
Figure 4.
Expression patterns in METTL21C of G. gallus. The heat map was drawn in log10-transformed expression values. Red and blue represent relatively high and low expression, respectively, compared to the control. Lfh represents the chicken of Liangfenghua; Qjm represents the chicken of Qingjiaoma; Sy represents the chicken of Siyu; Ly represents the chicken of Lueyang. The numbers represent the age of the chickens in days.

