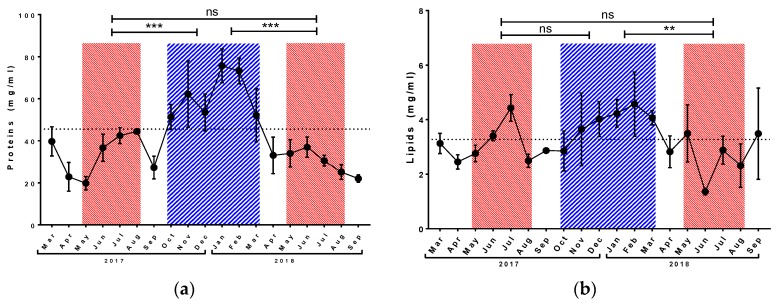
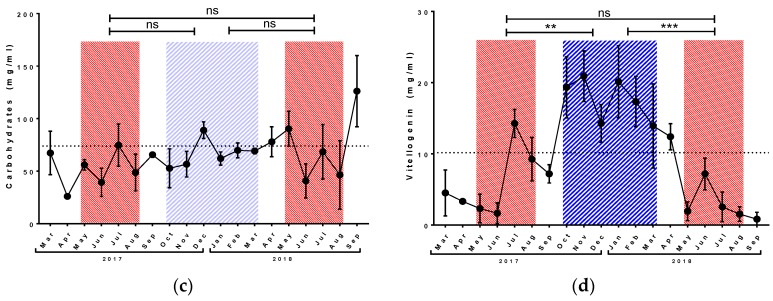
Figure 1.
Seasonal development of total protein (a), lipid (b), and carbohydrate (c) concentration and level of vitellogenin (d) in honey bee haemolymph. Red striped areas indicate summer generations of honey bees (May–August), and blue area indicates winter generations (October–March). Dots represent mean ± SD, n = 3–5. Dotted line represents annual average (October 2017–September 2018). Asterisk indicates significant difference ** p < 0.01, *** p < 0.001, ns = not significant.


