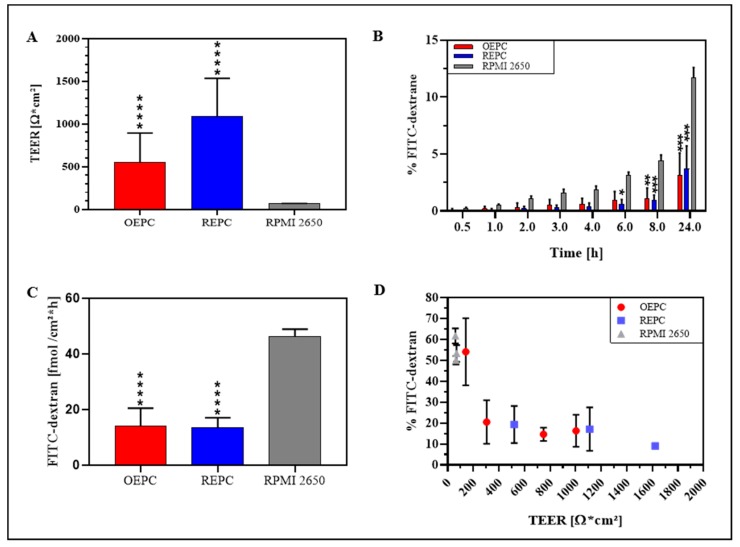
Figure 5.
Comparison of FITC-dextran permeation and TEER value of nasal primary cells vs. RPMI 2650. (A) TEER values of OEPC, REPC and RPMI 2650 after 21 days ALI. (B) FITC-dextran permeation data: Values of FITC-dextran permeated through a cell layer were normalized to total of FITC-dextran. (C) Flux of FITC-dextran through an OEPC, REPC and RPMI 2650 layer after 24 h. (D) Correlation of percentage FITC-dextran permeation after 24 h and TEER value. Statistical analysis: unpaired t-test, * p < 0.05, ** p < 0.01, *** p < 0.001, **** p < 0.0001; all compared to the standard model RPMI 2650. OEPC: olfactory epithelial primary cells; REPC: respiratory epithelial primary cells; TEER: Transepithelial electrical resistance. FITC-dextran: Fluorescein isothiocyanate-dextran; N = 4, n = 21; error bars represent mean ± SD of all repetitions.

