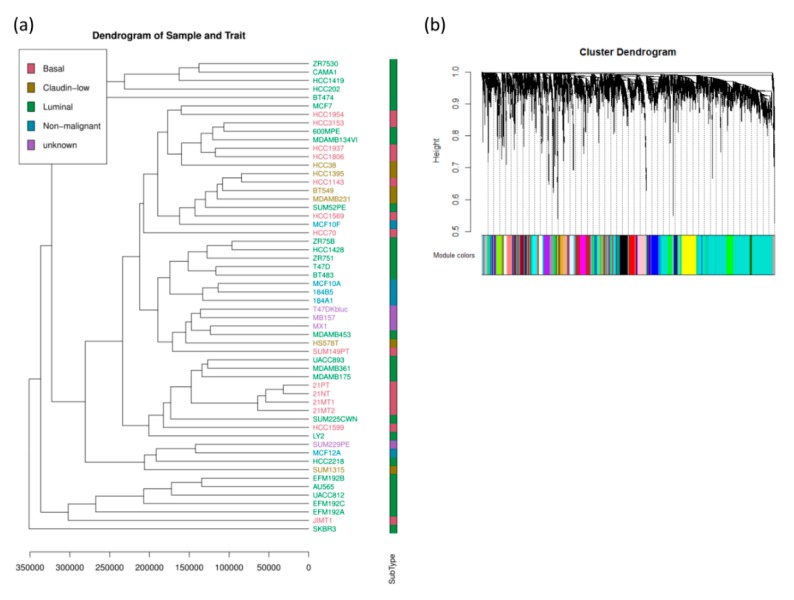
Figure 3.
(a) Clustering dendrogram of 56 breast cancer cell lines and the clinical trial. (b) Dendrogram of all differentially expressed genes clustered based on a dissimilarity measure. Dynamic tree cutting was applied to identify modules by dividing the dendrogram at significant branch points. Modules are displayed with different colors in the horizontal bar immediately below the dendrogram.

