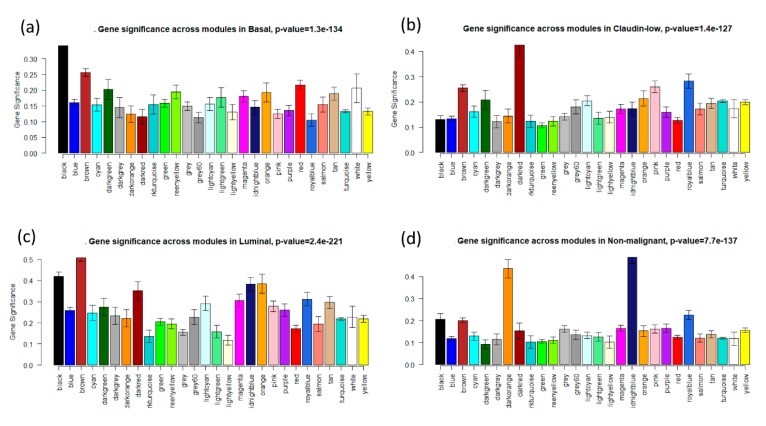
Figure 4.
Distribution of average gene significance in the modules based on different subtypes. (a) Black modules—highest association with basal. (b) Dark red modules—association with claudin-low. (c) Brown modules—highest association with luminal. (d) Midnight blue modules—highest association with nonmalignant.

